 Catalogue PIGMA
Density
Type of resources
Available actions
Topics
Keywords
Contact for the resource
Provided by
Years
Formats
Representation types
-
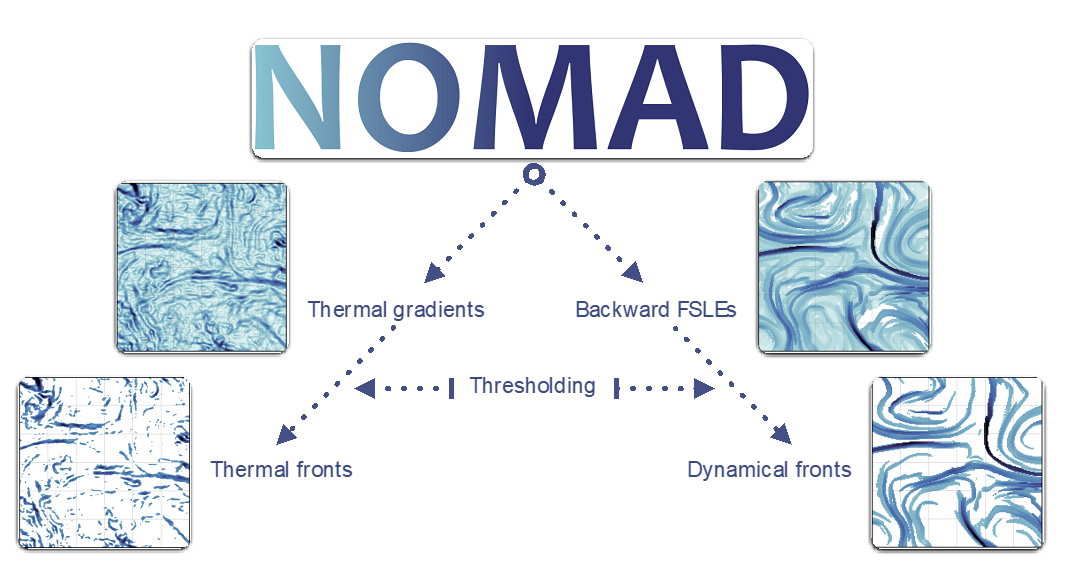
Fronts are ubiquitous discrete features of the global ocean often associated with enhanced vertical velocities, in turn boosting primary production and so forth. Fronts thus form dynamical and ephemeral ecosystems where numerous species meet across all trophic levels. Fronts are also targeted by fisheries. Capturing ocean fronts and studying their long-term variability in relation with climate change is thus key for marine resource management and spatial planning. The Mediterranean Sea and the Southwest Indian Ocean are natural laboratories to study front-marine life interactions due to their energetic flow at sub-to-mesoscales, high biodiversity (including endemic and endangered species) and numerous conservation initiatives. Based on remotely-sensed Sea Surface Temperature and Height, we compute thermal fronts (2003-2020) and attracting Lagrangian Coherent Structures (1994-2020), in both regions over several decades. We advocate for the combined use of both thermal fronts and attracting Lagrangian Coherent Structures to study front-marine life interactions. The resulting front database differs from other alternatives by its high spatio-temporal resolution, long time coverage, and relevant thresholds defined for ecological provinces.
-
This dataset contains OAC-P results from application to Argo data in the World Ocean : - the 2000-2015 climatology of OAC-P results mapped onto a 0.5x0.5 grid with mapping error estimates; - the 2000-2015 probability density function of the permanent pycnocline potential density referenced to the sea surface vs Brunt-Väisälä frequency squared.OAC-P is an "Objective Algorithm for the Characterization of the permanent Pycnocline" developed to characterize subtropical gyre stratification features with both observed and modeled potential density profiles. OAC-P estimates the following properties: - for the permanent pycnocline: depth, upper and lower thicknesses, Brunt-Väisälä frequency squared, potential density, temperature and salinity; - for the surface mode water overlying the permanent pycnocline: depth, Brunt-Väisälä frequency squared, potential density, temperature and salinity. Argo data were download from Coriolis Argo GDAC on February, 8th 2016. Only Argo data with QC=1, 2, 5 or 8 were used.
-
This dataset provides a World Ocean Atlas of Argo inferred statistics. The primary data are exclusively Argo profiles. The statistics are done using the whole time range covered by the Argo data, starting in July 1997. The atlas is provided with a 0.25° resolution in the horizontal and 63 depths from 0 m to 2,000 m in the vertical. The statistics include means of Conservative Temperature (CT), Absolute Salinity, compensated density, compressiblity factor and vertical isopycnal displacement (VID); standard deviations of CT, VID and the squared Brunt Vaisala frequency; skewness and kurtosis of VID; and Eddy Available Potential Energy (EAPE). The compensated density is the product of the in-situ density times the compressibility factor. It generalizes the virtual density used in Roullet et al. (2014). The compressibility factor is defined so as to remove the dependency with pressure of the in-situ density. The compensated density is used in the computation of the VID and the EAPE.
-
The upper ocean pycnocline (UOP) monthly climatology is based on the ISAS20 ARGO dataset containing Argo and Deep-Argo temperature and salinity profiles on the period 2002-2020. Regardless of the season, the UOP is defined as the shallowest significant stratification peak captured by the method described in Sérazin et al. (2022), whose detection threshold is proportional to the standard deviation of the stratification profile. The three main characteristics of the UOP are provided -- intensity, depth and thickness -- along with hydrographic variables at the upper and lower edges of the pycnocline, the Turner angle and density ratio at the depth of the UOP. A stratification index (SI) that evaluates the amount of buoyancy required to destratify the upper ocean down to a certain depth, is also included. When evaluated at the bottom of the UOP, this gives the upper ocean stratification index (UOSI) as discussed in Sérazin et al. (2022). Three mixed layer depth variables are also included in this dataset, including the one using the classic density threshold of 0.03 kg.m-3, along with the minimum of these MLD variables. Several statistics of the UOP characteristics and the associated quantities are available in 2°×2° bins for each month of the year, whose results were smoothed using a diffusive gaussian filter with a 500 km scale. UOP characteristics are also available for each profile, with all the profiles sorted in one file per month.