 Catalogue PIGMA
Fish
Type of resources
Available actions
Topics
Keywords
Contact for the resource
Provided by
Years
Formats
Representation types
Update frequencies
status
Resolution
-
1) Demographic traits These data are published data of age-specific mortality rates, age-specific lengths or weights, length and age at maturity, fecundity-length relationships, and egg size for 84 populations from 49 species of primarily commercial teleost fishes. The populations included are those for which all the life history traits under study have been estimated over a period shorter than 10 years. Traits were estimated from within the ten year window or averaged across it when data were available. Only studies in which reference population, sample size, techniques used for ageing fish and counting eggs, and models used for estimating mortality were reported are included. When only a size or age range was available, the midpoint between the extreme values was used. Raw data were converted into seven demographic traits: - Time-to-5%-survival (T.05): the time elapsed from sexual maturity until 95% of a cohort is dead. T.05 fwas estimated from an exponential mortality model, based on total mortality coefficients estimated by Virtual Population Analysis (age-structured model) in most cases or cohort analysis or catch curves. - Length-at-5%-survival (L.05). In fishes, adult size is difficult to measure because of their indeterminate growth. Adult size reported here is length at time-to-5%-survival. - Age at sexual maturity (Tm): median age at maturity was estimated directly from the data or by fitting a logistic curve to age-specific proportion mature data. When only an age range was available, the midpoint between minimum and maximum is reported. - Length at sexual maturity (Lm): median length at maturity was estimated as age at maturity. - Slope of the fecundity-length relationship (Fb): fish fecundity, defined as the number of eggs present in the ovaries immediately before spawning, is known to increase intraspecifically with the size of females. This increase is usually described by a power-law F = aLb. The exponent of this relationship, b (slope of the log-log fecundity-length regression), accounts for the increase in fecundity with size. - Fecundity at maturity (Fm): fecundity in the year of maturity was estimated from length at maturity, the fecundity-length relationship and the number of spawning bouts per year for batch spawners. - Egg volume (Egg): When information on egg size was unavailable in specific papers, values were borrowed from other studies, using the following criteria in the descending order: from the same period, the same population, the same species. In five species of Perciformes no estimate was available for any population, thus egg volume was estimated from other species of the same family. 2) Fishing pressure Three types of environments with low, moderate and high fishing pressure were defined. - To scale the pressure exerted by fishing to the natural population turn-over, it was expressed as the ratio of fishing mortality to natural mortality rates (F/M). Data were gathered from the literature together with demographic traits. Authors use the following methods to estimate natural mortality rates: intercept of a regression of total mortality on fishing effort, linear relationship known between estimates of natural mortality, growth parameters and the temperature, or multispecies models. Fishing mortality rates were estimated from Virtual Population Analysis or cohort analysis, or as the difference between total and natural mortality. Three levels of fishing pressure were defined: low fishing pressure (fishing mortality lower than natural mortality, F/M < 1), intermediate (1 <= F/M < 2) and high (F/M >= 2).
-

Sardine physiological measurments from september to november 2020
-
The data come from organisms and pictures collected during the MEDITS annual bottom trawl surveys conducted between 2011 and 2013 (Bertrand et al. 2002). MEDITS surveys cover the continental shelf (10 m to 200 m depth) and the upper part of the continental slope (200 m to 800 m) on the Mediterranean. A total of 1511 individuals from 85 fish species were collected from seven Mediterranean areas (South Adriatic Sea, Sardinia, Gulf of Lions, around Cyprus, Mallorca, Tyrrhenian Sea, and North West Ionian Sea). A set of 14 morphological traits related to the habitat and the diet of the species were measured in the field and on pictures using the ImageJ software (version 1.47, http://imagej.nih.gov/ij/) (see Granger et al. 2015 and Brind'Amour et al. submitted for details) (Figure 1). Replicats of measures vary between 1 (e.g. Scorpaena loppei) to 53 (e.g. Serranus hepatus) according to fish species. Twelve of the chosen traits consist in continuous biological characteristics measured on each individual (measured in cm). The two remaining traits are categorical and determined at the species level.
-
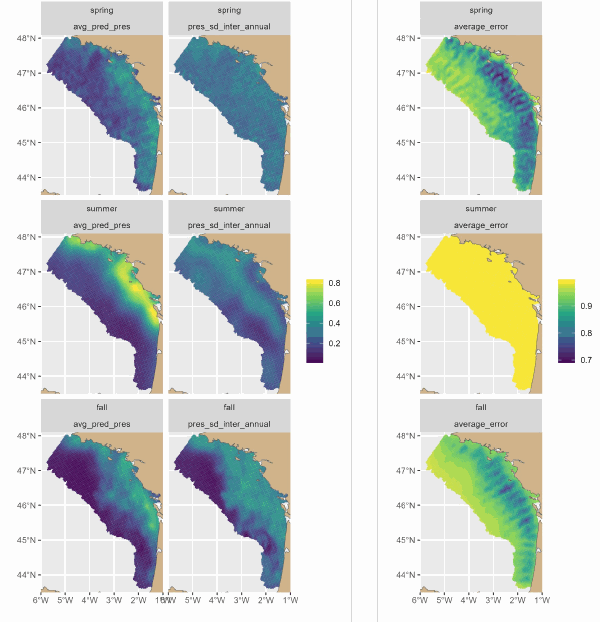
The Delmoges project aims to generate new ecological and fisheries knowledge to reduce dolphin bycatch in the Bay of Biscay (GoG). This dataset presents maps produced by a hierarchical model of the seasonal and interannual distribution of dolphins' main prey, small pelagic fish. The model integrates 3 types of data: presence-absence and biomass of fish from scientific campaigns and presence of fish from fishing data. For the first time, the model has provided a quantitative description of the seasonal spatial dynamics of sardines and associated fisheries. The main sardine distribution areas were coastal, from the mouth of the Gironde to south-west Brittany. On average, sardines were distributed over a wider area in small aggregations in spring. They seemed to concentrate in their main distribution areas in summer, and to disperse offshore in autumn, but to a lesser extent than in spring. Fishing was concentrated in the sardine's main coastal distribution areas, and was more intense in summer, then autumn, and less intense in spring.
-
Data were collected from the regional program LOUPE (Observation of the habitat and associated communities in the context of the fisheries of the Capbreton Canyon). It consisted in the observations of two métiers practiced around the canyon. The observations were carried out between July 2011 and April 2013 on coastal boats. Observations and interviews were made on board commercial vessels. The longlines used in the hake fishery are semi-pelagic and are deployed on the edge of the Capbreton Canyon. It is an emblematic and major métier benefiting from a particular regulation as they take advantage of a prohibition of net and trawl fishing on their fishing grounds. Between 8 and 14 costal boats practice this métier during the year and the fleet characteristics are homogeneous. Boats lay between 1,200 and 1,800 hooks per day, baited with frozen pilchard (Sardina pilchardus). Two or three men are on board these vessels. Fishing is mostly practiced in spring and summer but a small number of vessels work all year. Generally, trips last between ten and twelve hours; longline is set before sunrise and retrieved three or four hours later. Hake is the main targeted species; other targets are pollack (Pollachius pollachius), red sea bream (Pagellus bogaraveo) and conger (Conger conger). Netting is a major métier in terms of vessels involved and the number of trips. Crew composition varies and depends on boat length (from one to four men on average). This métier is practiced by 30 to 35 boats all year round, but fleet characteristics are less homogeneous than in the case of longliners . The strategy of these netters operating in the coastal area is based on the use of several types of nets (gillnets and trammel nets) targeting several species, often sold directly to consumers on the docks. Gillnets, consisting of a single mesh, target hake, sea bass and sea bream species (Diplodus spp, Sparus aurata, Litognathus mormyrus), while the trammel nets (three meshes) are used to capture benthic fish, such as common sole, monkfish (Lophius spp), turbot and brill (Scophthalmus rhombus). Generally, trips last less than twelve hours for coastal netters (less than 15 m), which predominate in the sector, and a few days for large netters. On average, the coastal vessels set 6000 to 8000 m. nets daily.
-
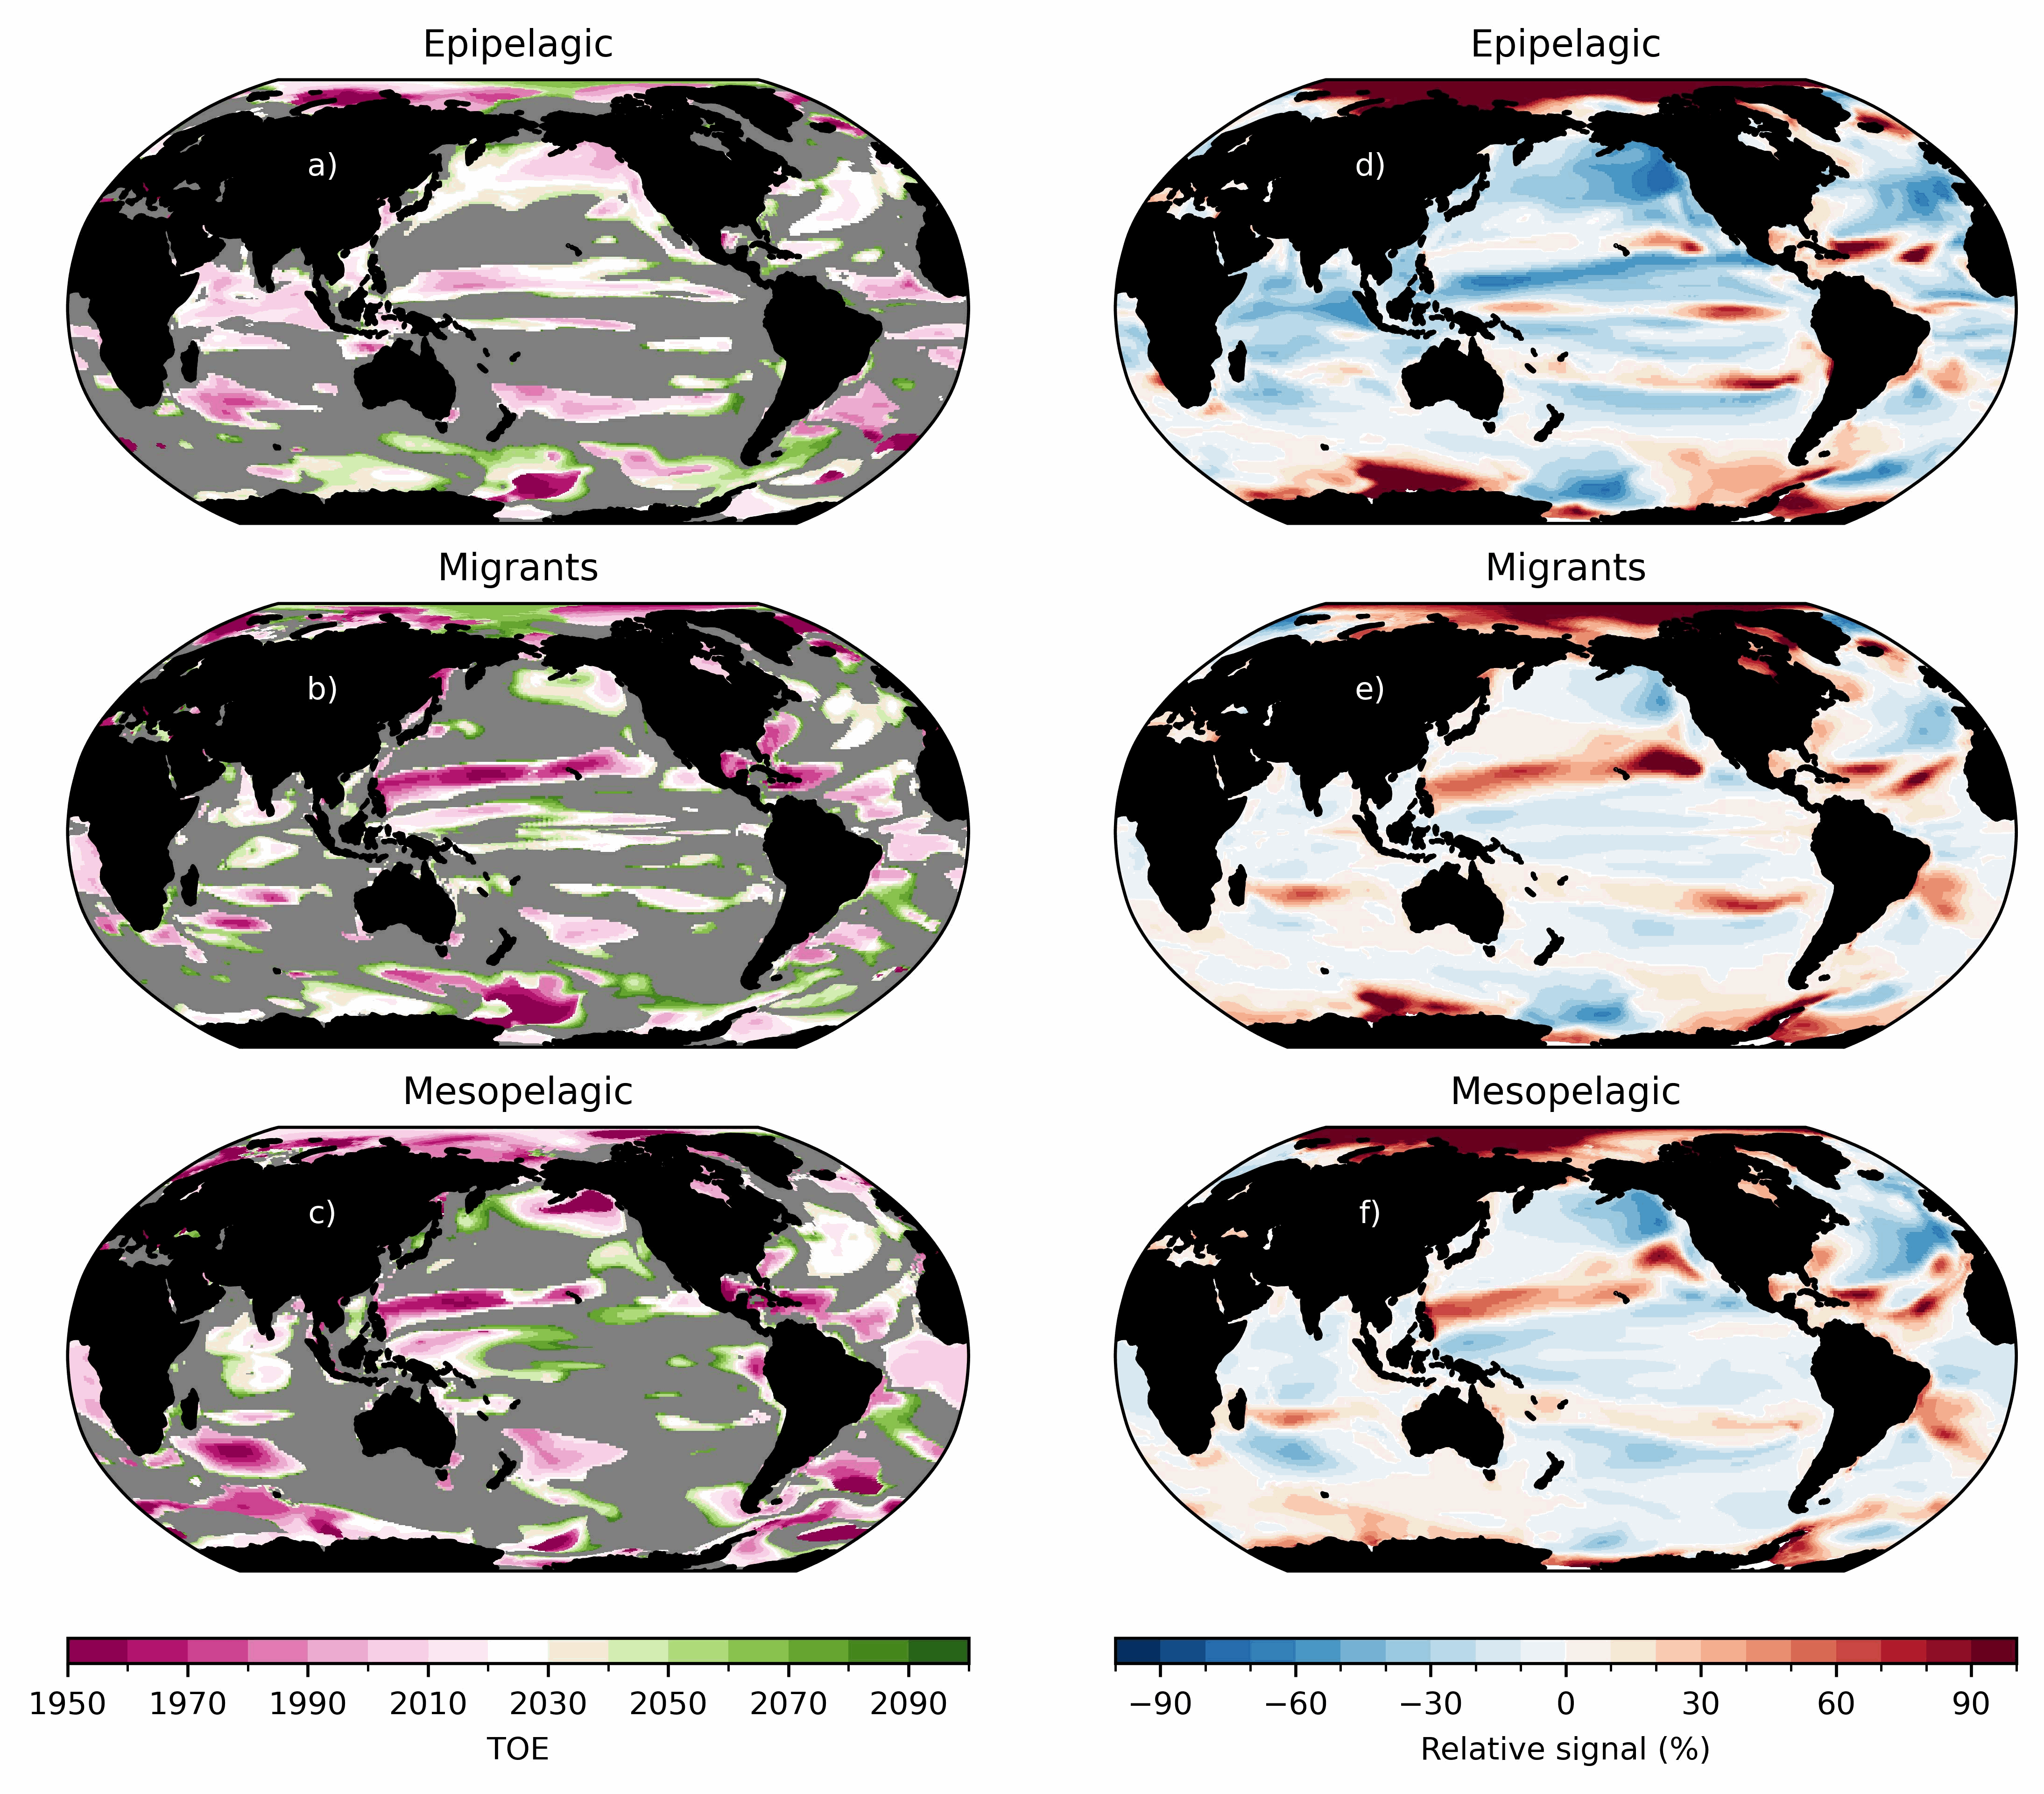
Ensemble simulations of the ecosystem model Apecosm (https://apecosm.org) forced by the IPSL-CM6-LR climate model with the climate change scenario SSP5-8.5. The output files contain yearly mean biomass density for 3 communities (epipelagic, mesopelagic migratory and mesopelagic redidents) and 100 size classes (ranging from 0.12cm to 1.96m) The model grid file is also provided. Units are in J/m2 and can be converted in kg/m2 by dividing by 4e6. These outputs are associated with the "Assessing the time of emergence of marine ecosystems from global to local scales using IPSL-CM6A-LR/APECOSM climate-to-fish ensemble simulations" paper from the Earth's Future "Past and Future of Marine Ecosystems" Special Collection.
-
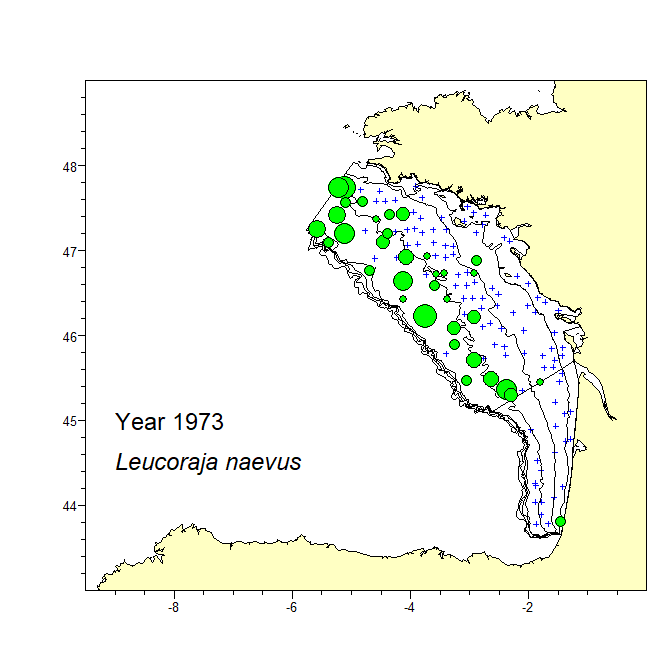
A consistent dataset of bottom trawl survey data spanning 47 years in the Bay of Biscay was assembled. The dataset includes data from the current EVHOE survey from 1987 to 2019 and two previous surveys carried out in 1973 and 1976. The recent EVHOE time-series from 1997 is also available from DATRAS (https://www.ices.dk/data/data-portals/Pages/DATRAS.aspx). The catch in numbers and weight (kg) per haul of all Rajiformes species caught in these surveys is provided. Haul information is provided for all hauls, including those with no catch of Rajiformes. Areas of the sampling strata of the survey and spatial polygones of these strata are provided in separate files.
-
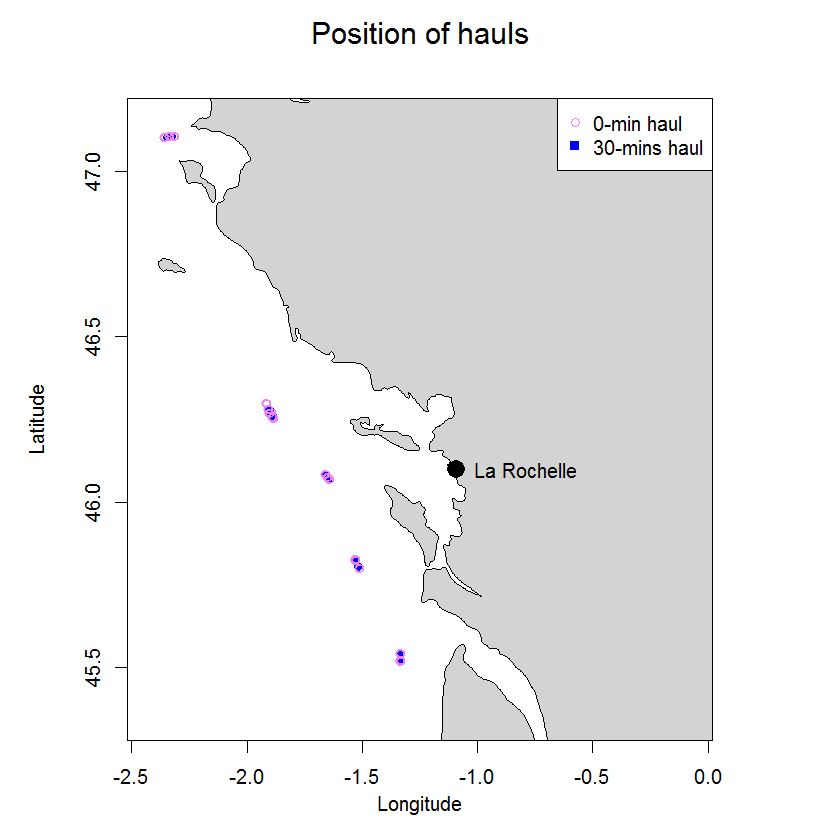
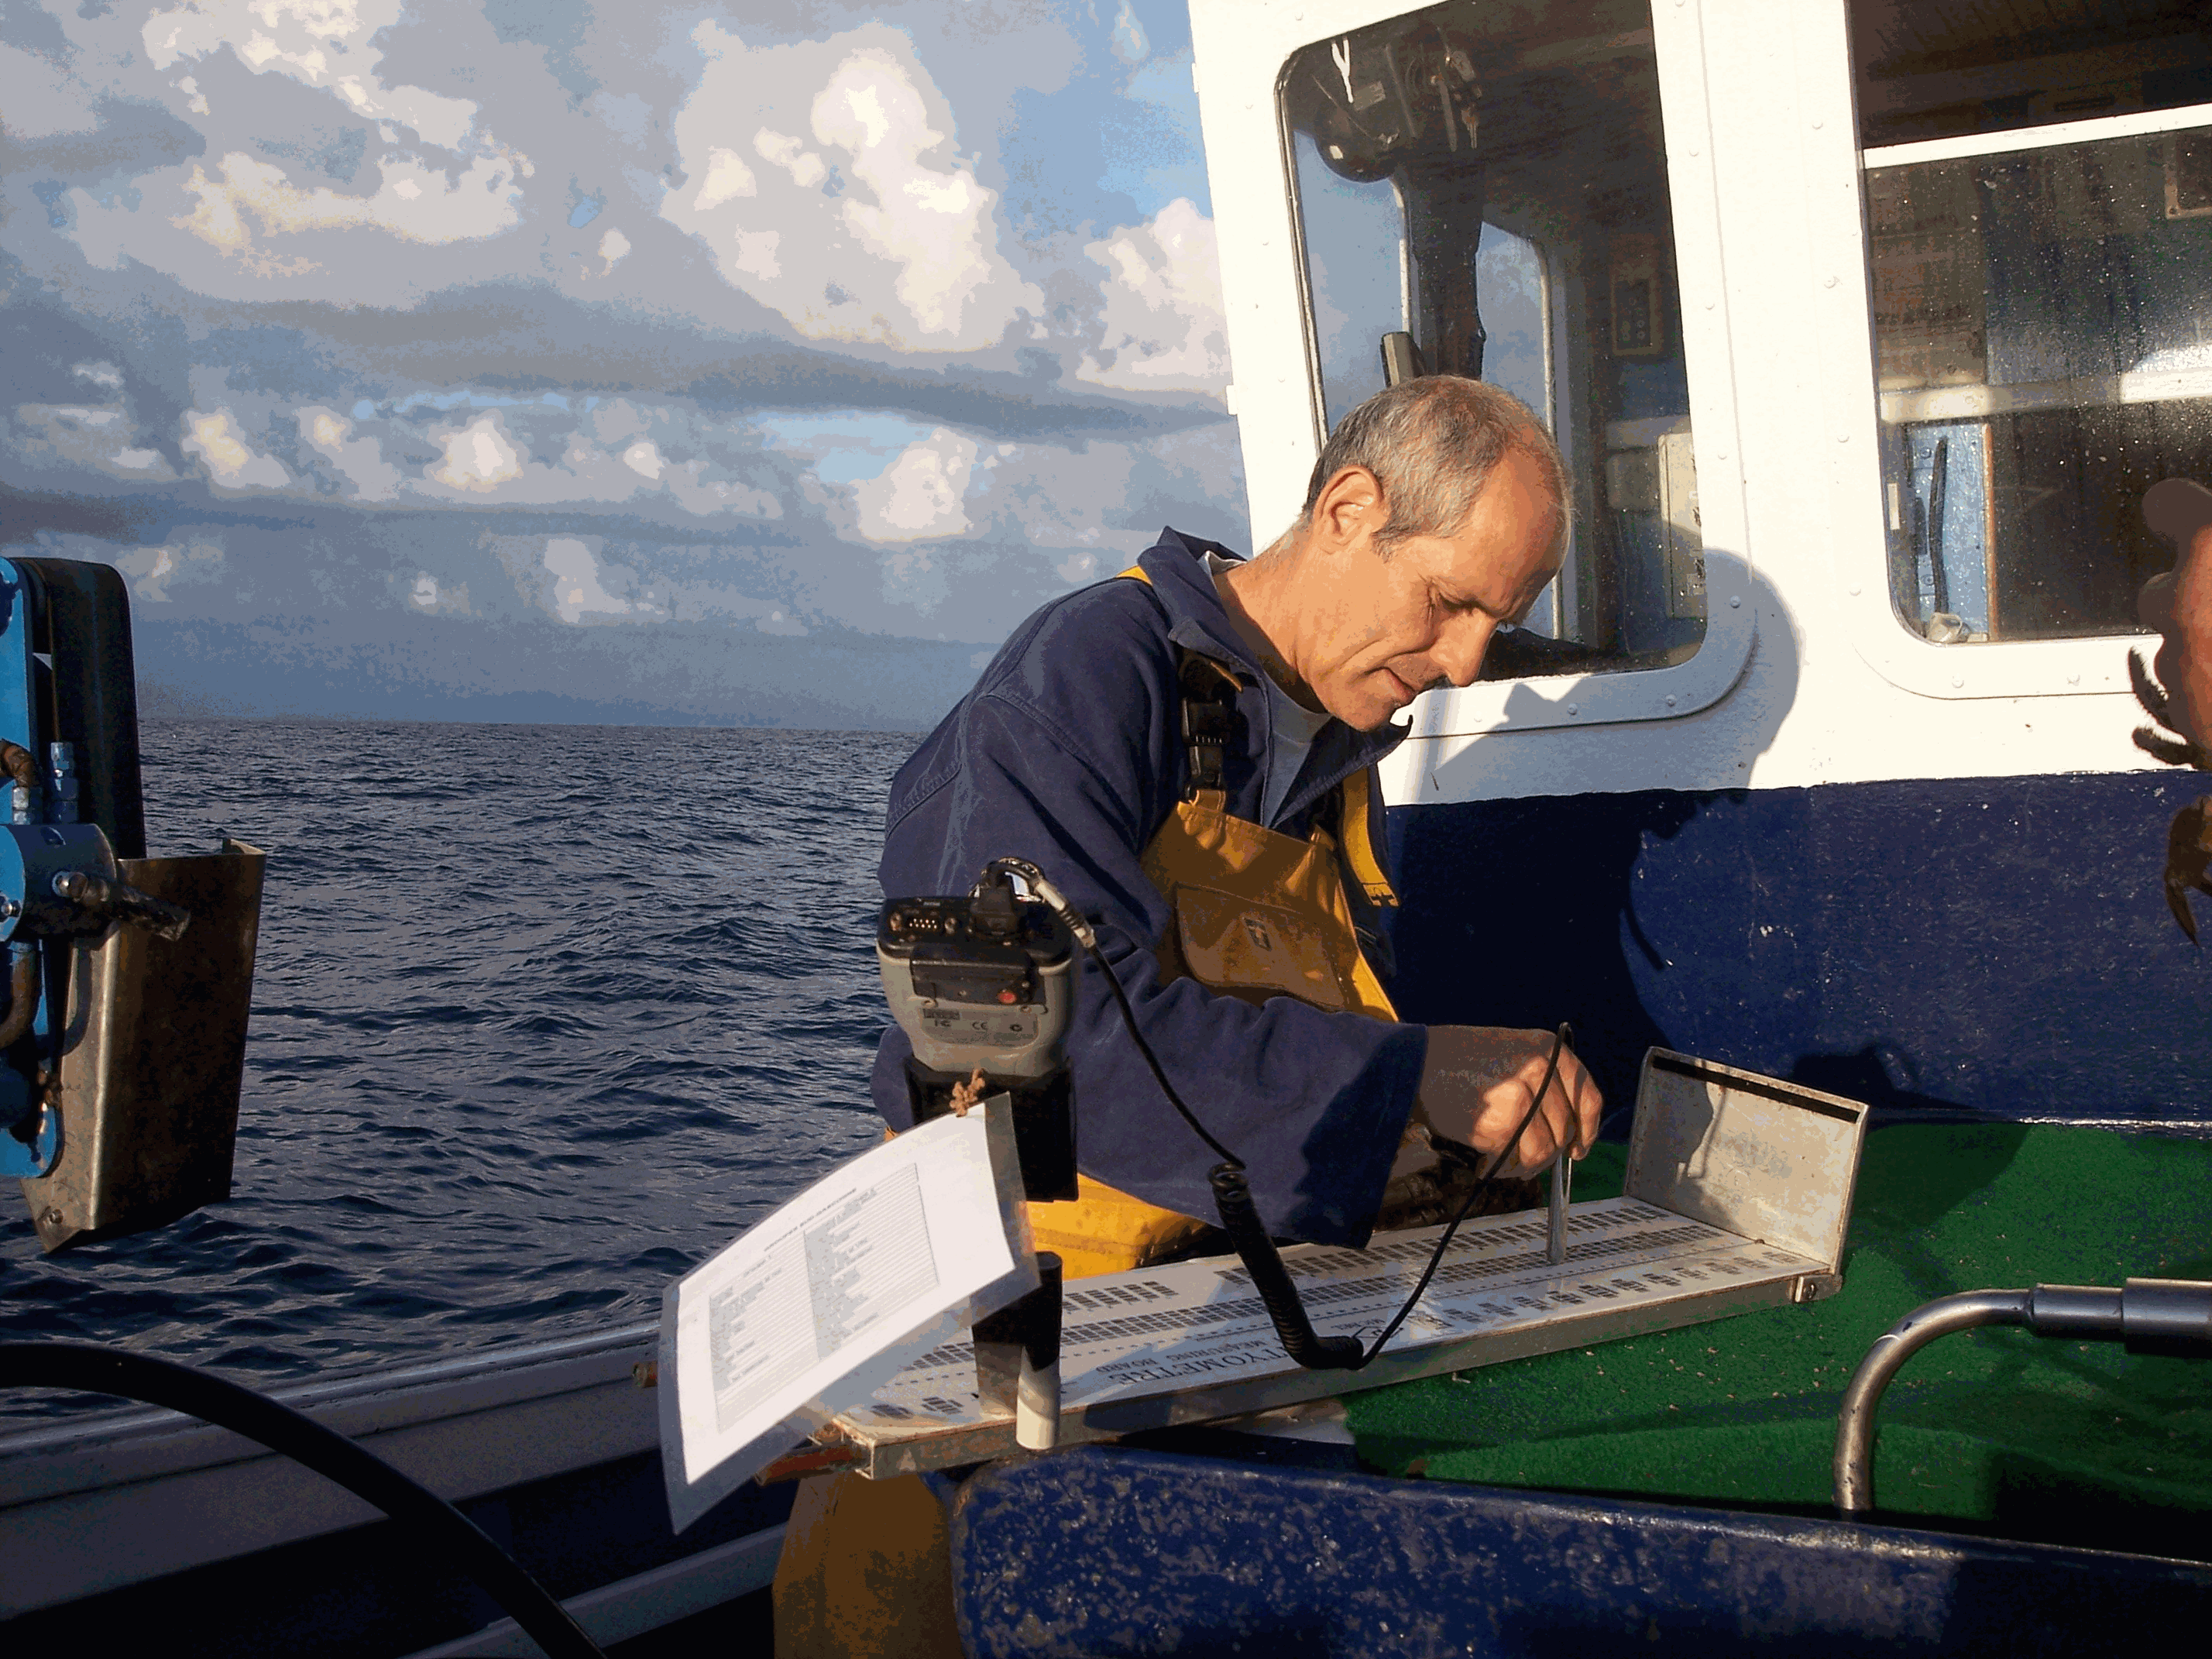
In 2003 two experiments were carried out in the Bay of Biscay to compare catch numbers obtained in standard research 30-min hauls with those from 0-min hauls to determine the so called end effect. The end effect in trawl catches is defined as the proportion of the fish catch taken during shooting and hauling of the net, a period excluded from what is nominally referred to as haul duration. In 0-hauls the trawl was hauled as soon as the trawl geometry stabilized on the seabed. The trawl used was a beam trawl rigged as twin trawl. Overall 24 hauls were carried out, six 30-min and 18 0-min hauls. Average catch ratios (0-min/30-min hauls) ranged from 0.05 (s.d. 0.06) for sole to 0.34 (s.d. 0.64) for hake.
-
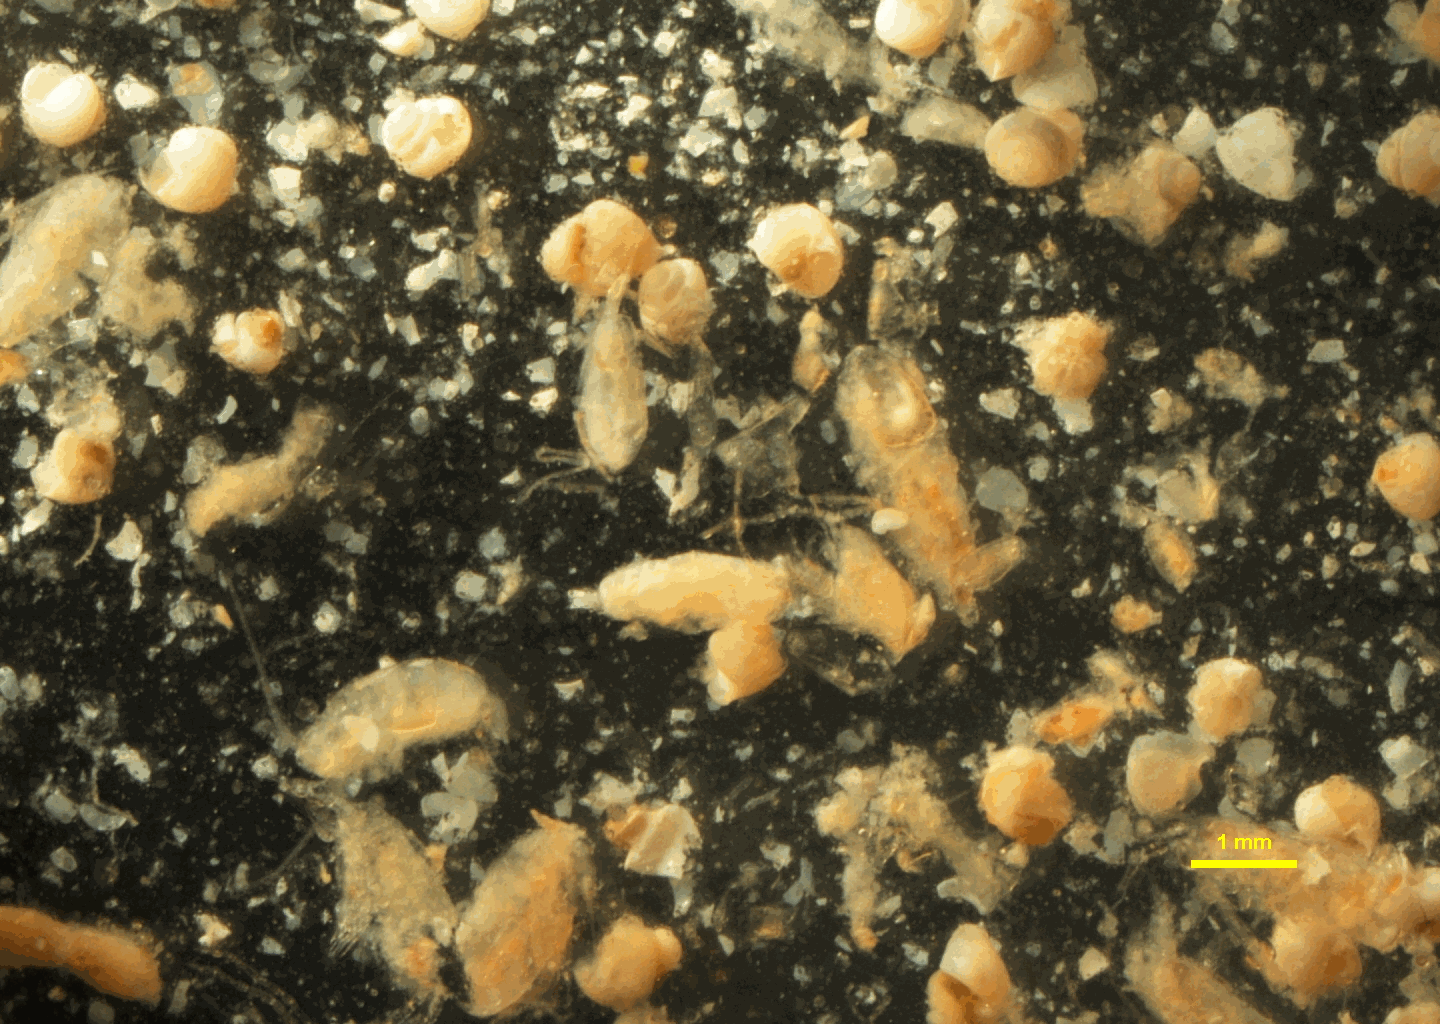
This dataset comprises stomach contents of small pelagic fish species on the french shelf of the Bay of Bisacy, in spring, autumn and winter, from 2004 to 2024. The spring data were acquired in May on the pelagic survey series PELGAS from 2004 to 2024, the autumn data in October/Novermber on the demersal survey series EVHOE from 2020 to 2024 and the winter data were acquired on chartered fishing vessels in February 2023 and 2024. The dataset concerns anchovy (Engraulis encrasicolus) and sardine (Sardina pilchardus) in the 3 seasons and also mackerel (Scomber scombrus), sprat (Sprattus, sprattus) and horse mackerel (Trachurus trachurus) in spring for some years. The dataset represents a unique long-term monitoring of stomach contents characterized with a low taxonomic resolution and semi-quantitative abundance quotation. The pelagic ecosystem survey PELGAS (Doray et al., 2018) is run in each year in May since 2000, to monitor the Bay of Biscay pelagic ecosystem at springtime and assess the biomass of its small pelagic fish species. During the survey, pelagic trawl hauls are undertaken to identify echotraces to species and to measure individual fish traits. All hauls are performed during day time. In 2010, some hauls were undertaken at night to sample stomach contents over the day/night cycle. The fish stomachs are sampled from the haul catch. For a given species, twenty individuals are selected at random from the catch, their stomachs dissected and preserved. This is repeated at three hauls in each of the ten spatial strata defined to cover the entire Biscay shelf. In some years, fish length categories (lower and greater than 14 cm for anchovy and 18 cm for sardine) were also considered when sampling the stomachs. Stomach sampling by species depended on the trawl haul catch and all species were not systematically sampled jointly at the same trawl haul. Also, the number of stations with stomach sampling varied between species and years. The stomachs were preserved in formaline until 2018 and in ethanol since. Anchovy and sardine stomach sampling on the demersal survey EVHOE (Mahe and Poulard, 2005) followed the same protocole as for PELGAS but with fewer stations, depending on the catch of anchovy and sardine in the bottom trawl. In 2020 due to the Covid pandemic, the PELGAS survey was canceled and to compensate, a pair-trawler was chartered in autumn to perform some pelagic trawl hauls during the EVHOE 2020 survey. In winter 2023 and 2024 a pair-trawler was also chartered, for identifying echotraces observed previously on the survey DRIX (Doray et al., 2024) in the area delimited by the Gironde and Loire estuaries, the coast and the 100 m isobath. On the fishing vessels the fish were frozen onboard, the stomachs were dissected on land in the laboratory and preserved in ethanol. The taxonomic analysis of the stomach contents was performed in the laboratory under a binocular magnifyer by the company LAPHY. A simplified taxonomic resolution was used, which considered five ichtyoplankton groups, two copepod groups, euphausids or mysids, amphipods, two decapod groups, other crustacea, other zooplankton, phytoplankton and pulp. Taxon abundance was defined by a quotation : 0 (absence), 1 (presence : <10 individuals), 2 (abundant : between 10 and 100), 3 (very abundant : > 100). The dataset comprises trawl haul information, information on the quality of the stomach contents and abundance quotes for the list of plankton taxons. A preliminary analysis of the data (Petitgas, 2024) showed a large overlap in stomach contents between species, the importance of small copepods in the diets, and how different drivers such as habitat and length influence the diets.
-
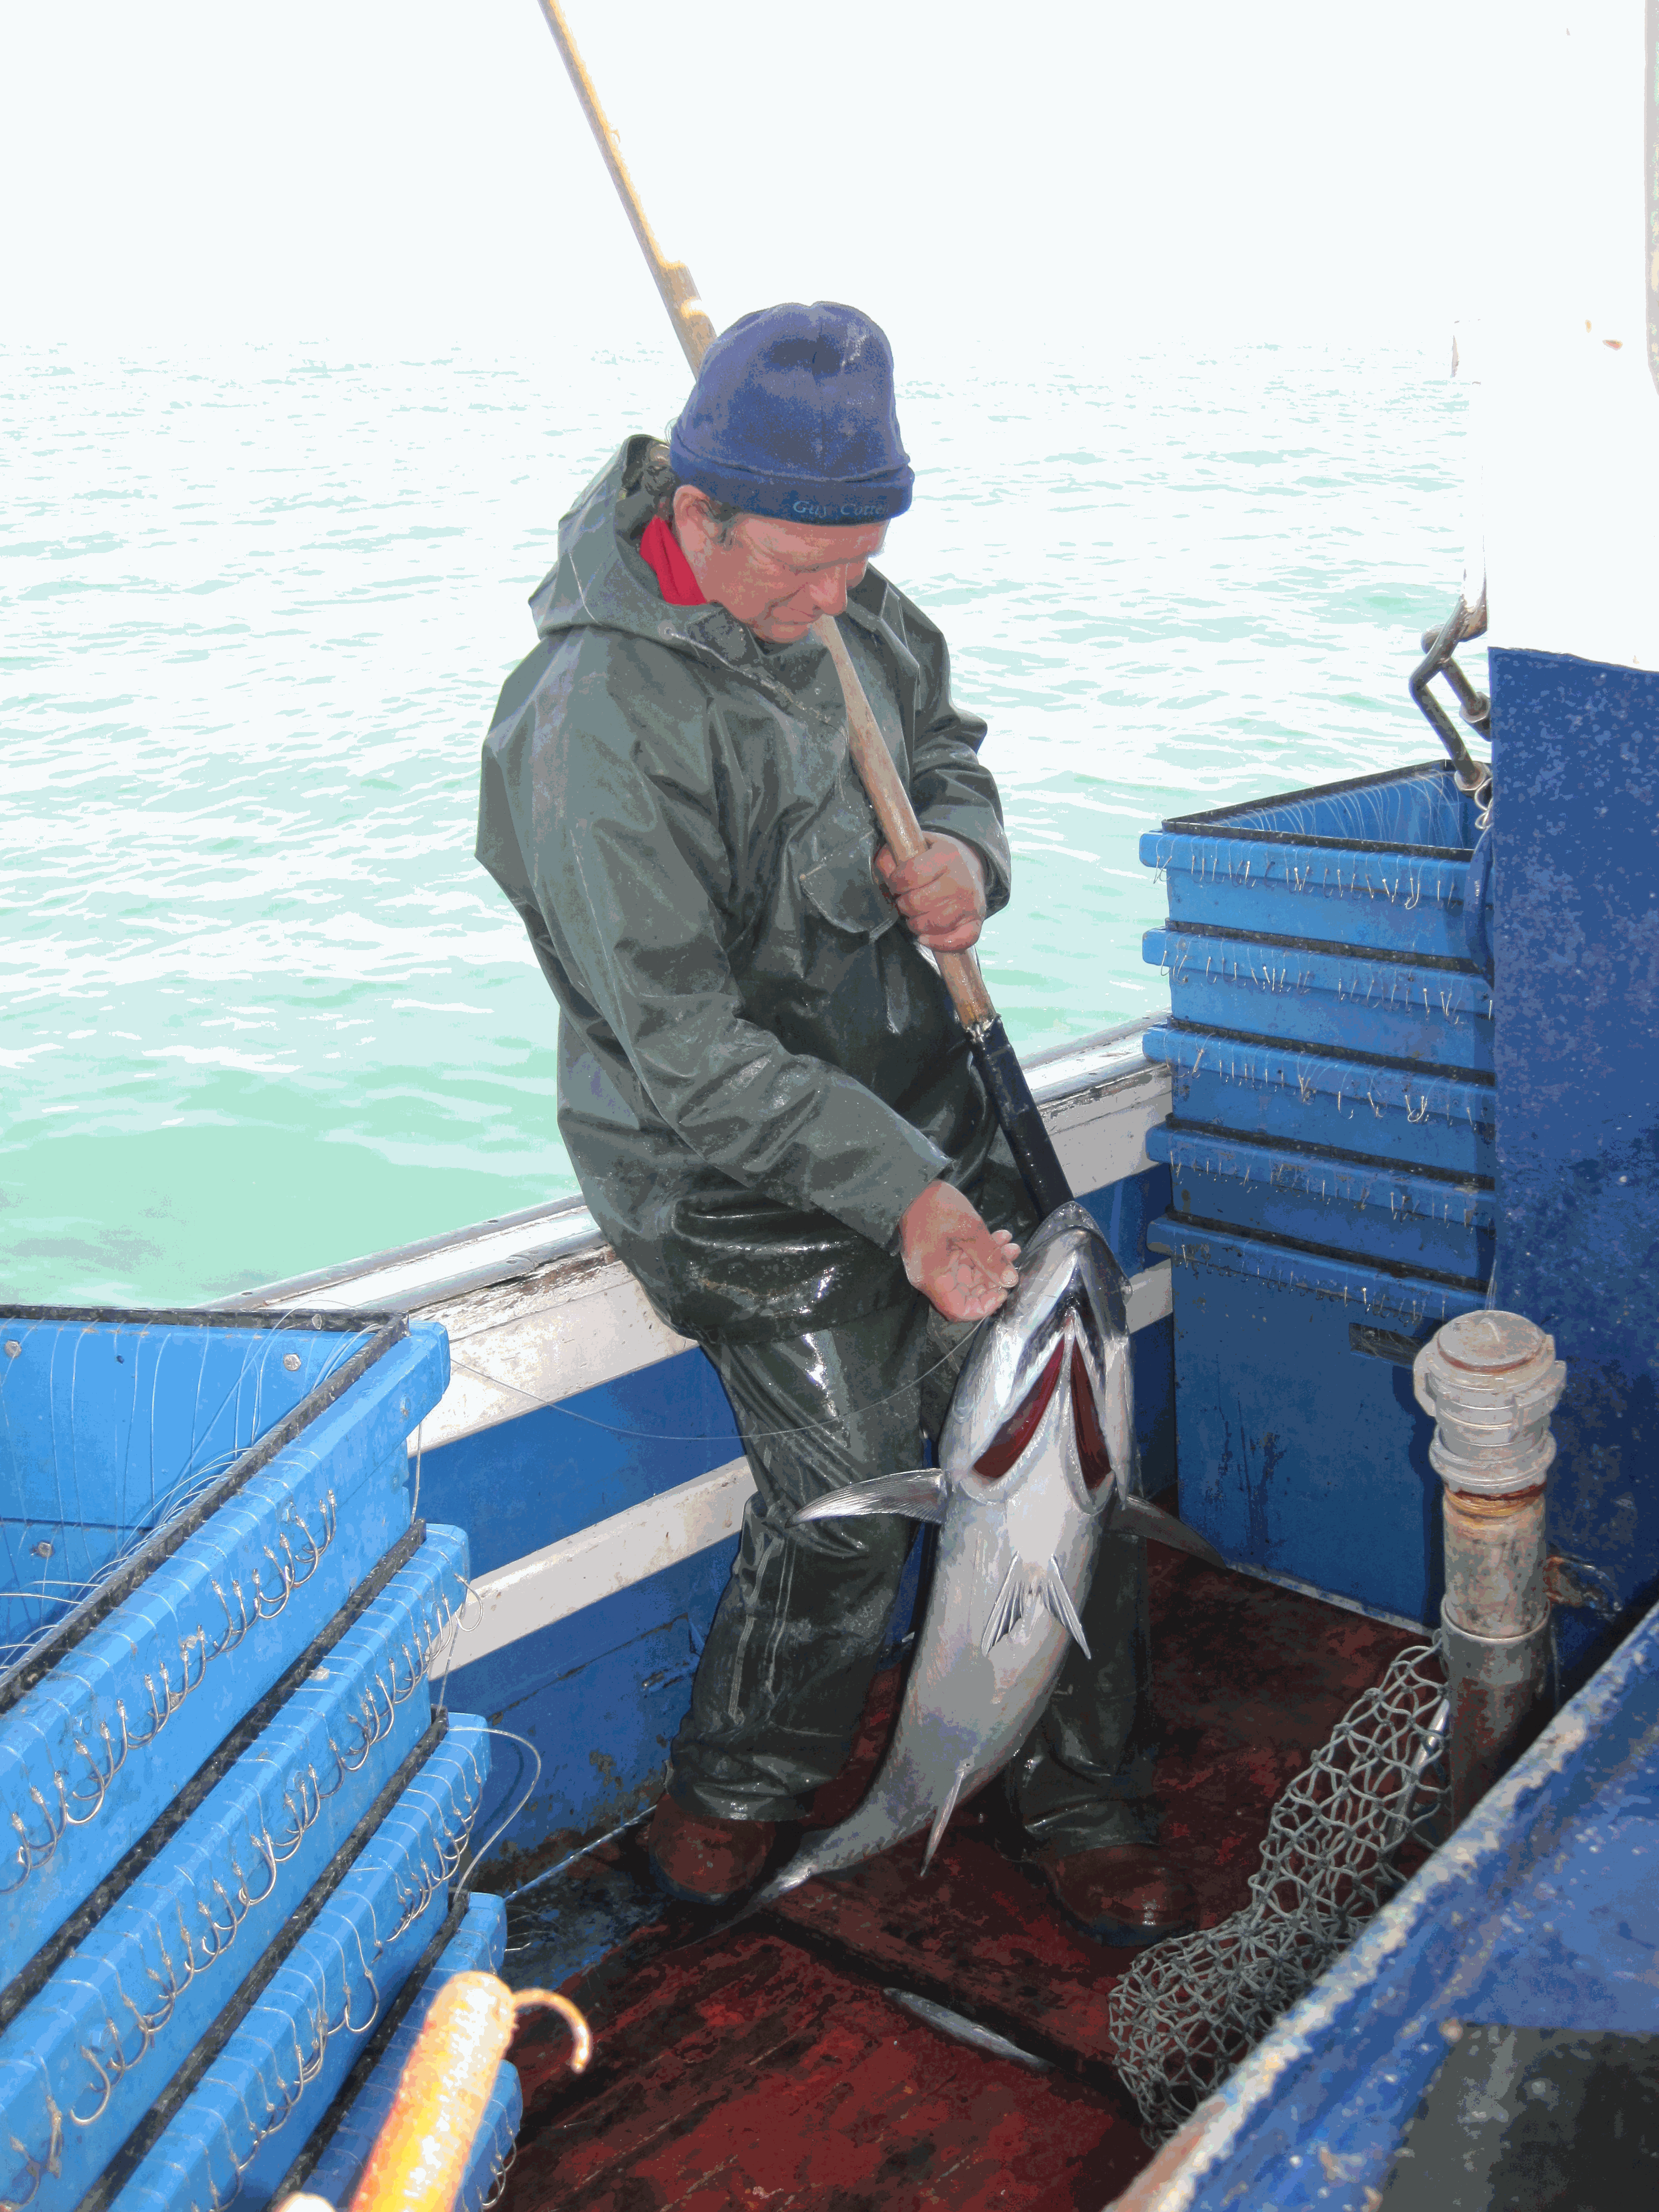
In 1967, E.Postel, researcher at the OSTPM (Scientific and Technical Office for Maritime Fisheries) set up a data collection system on albacore catches by French fleets. JC Dao and FX Bard continued this work within CNEXO (National Center for the Exploitation of Oceans) and then at IFREMER from 1984. This information was transmitted by fishing professionals via logbooks, on the basis of volunteering (Dao, 1971, Bard, 1977). In 1982, the European Community put in place a mandatory system of declarations of fishing effort and catches via logbooks (EC Regulation No. 2057 in Sanchez and Santurtun, 2013). As a result, the two systems persisted between 1982 and 1986, with European logbooks gradually supplanting logbooks