 Catalogue PIGMA
Fisheries and aquaculture
Type of resources
Available actions
Topics
Keywords
Contact for the resource
Provided by
Years
Formats
Representation types
Update frequencies
status
Resolution
-
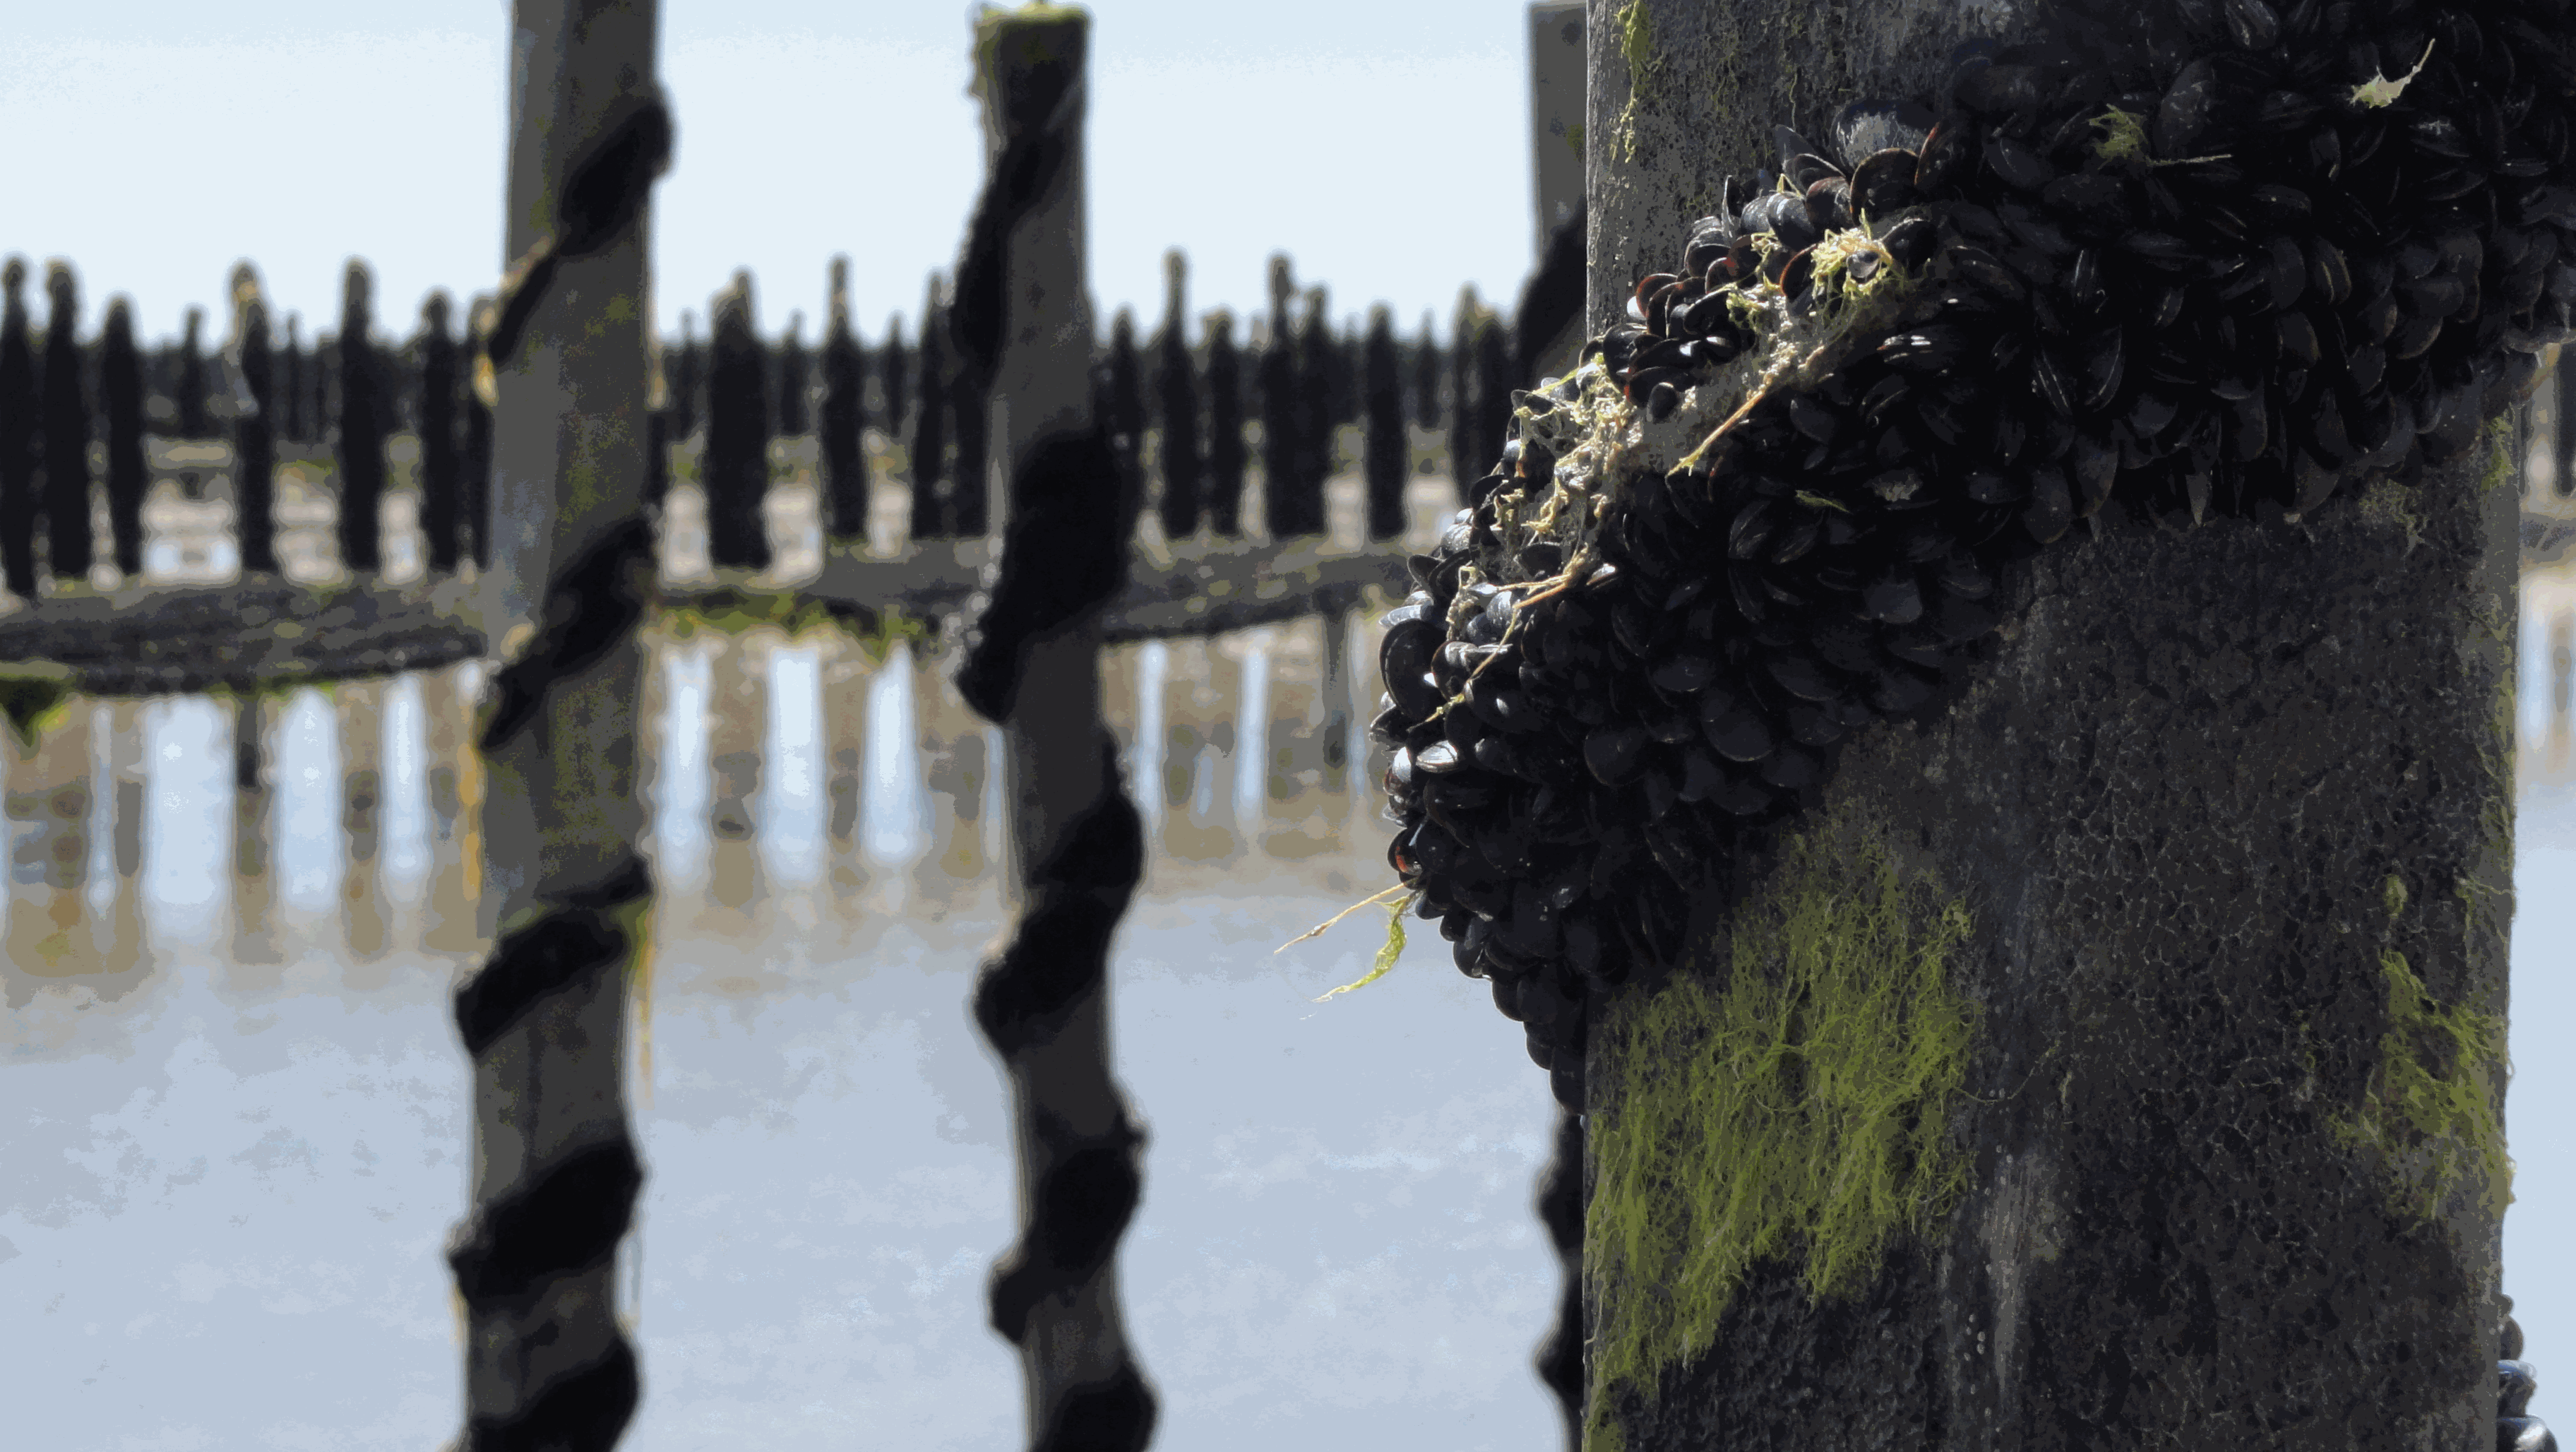
The Mytilobs network, carried out by IFREMER (French Research Institute for Exploitation of the Sea), is a national network dedicated to building long-term physiological variations time series of blue mussels (Mytilus edulis), across a large spatial scale. This observation network, initially designed to survey production yields, also provides valuable data to track environmental variations of coastal ecosystems. Mussels exhibit high phenotypic plasticity in response to environmental variations. Collection of data describing phenotypic variations, over an extended period, reveals small-scale climate and habitat variations. With its broad deployment across time and space, the data produced under Mytilobs will be useful for the establishment of a baseline condition when studying the effect of a perturbation affecting an ecosystem’s functioning. Finally, the monitoring of mussel biometric traits and mortality was coupled with high-frequency measurements of salinity, temperature, and sea level, complementing this multi-layer observational framework.
-
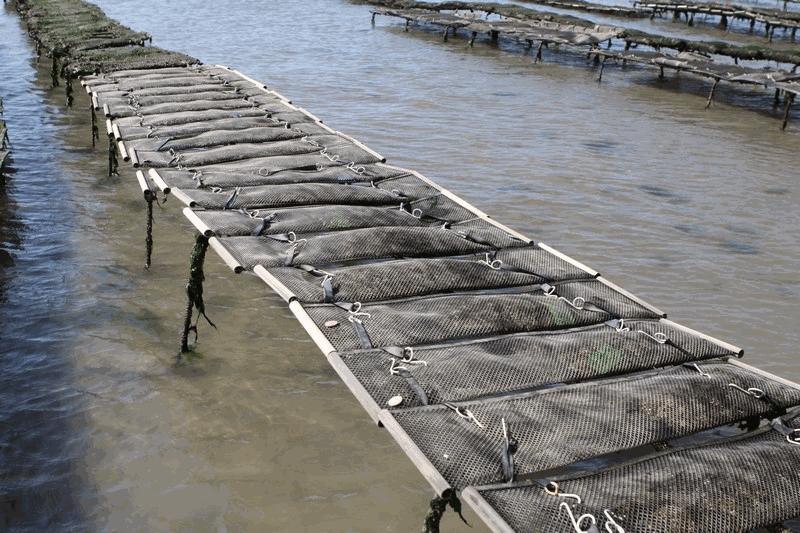
Survival was recorded at the endpoint for all batches of each group (2n-control, 2n-wild, 2n-commercial, 2nR, 3nR and 3n-commercial). Similarly, initial and final yield were recorded, corresponding to the total weight of the live oysters at deployment and at the endpoint. Finally, shell length and total weight for individually recorded at reception and at the endpoint.
-
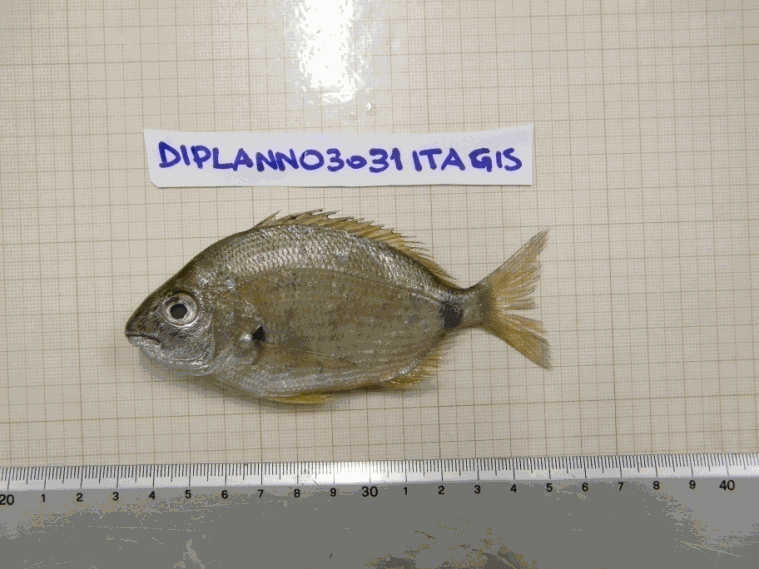
The data come from organisms and pictures collected during the MEDITS annual bottom trawl surveys conducted between 2011 and 2013 (Bertrand et al. 2002). MEDITS surveys cover the continental shelf (10 m to 200 m depth) and the upper part of the continental slope (200 m to 800 m) on the Mediterranean. A total of 1511 individuals from 85 fish species were collected from seven Mediterranean areas (South Adriatic Sea, Sardinia, Gulf of Lions, around Cyprus, Mallorca, Tyrrhenian Sea, and North West Ionian Sea). A set of 14 morphological traits related to the habitat and the diet of the species were measured in the field and on pictures using the ImageJ software (version 1.47, http://imagej.nih.gov/ij/) (see Granger et al. 2015 and Brind'Amour et al. submitted for details) (Figure 1). Replicats of measures vary between 1 (e.g. Scorpaena loppei) to 53 (e.g. Serranus hepatus) according to fish species. Twelve of the chosen traits consist in continuous biological characteristics measured on each individual (measured in cm). The two remaining traits are categorical and determined at the species level.
-
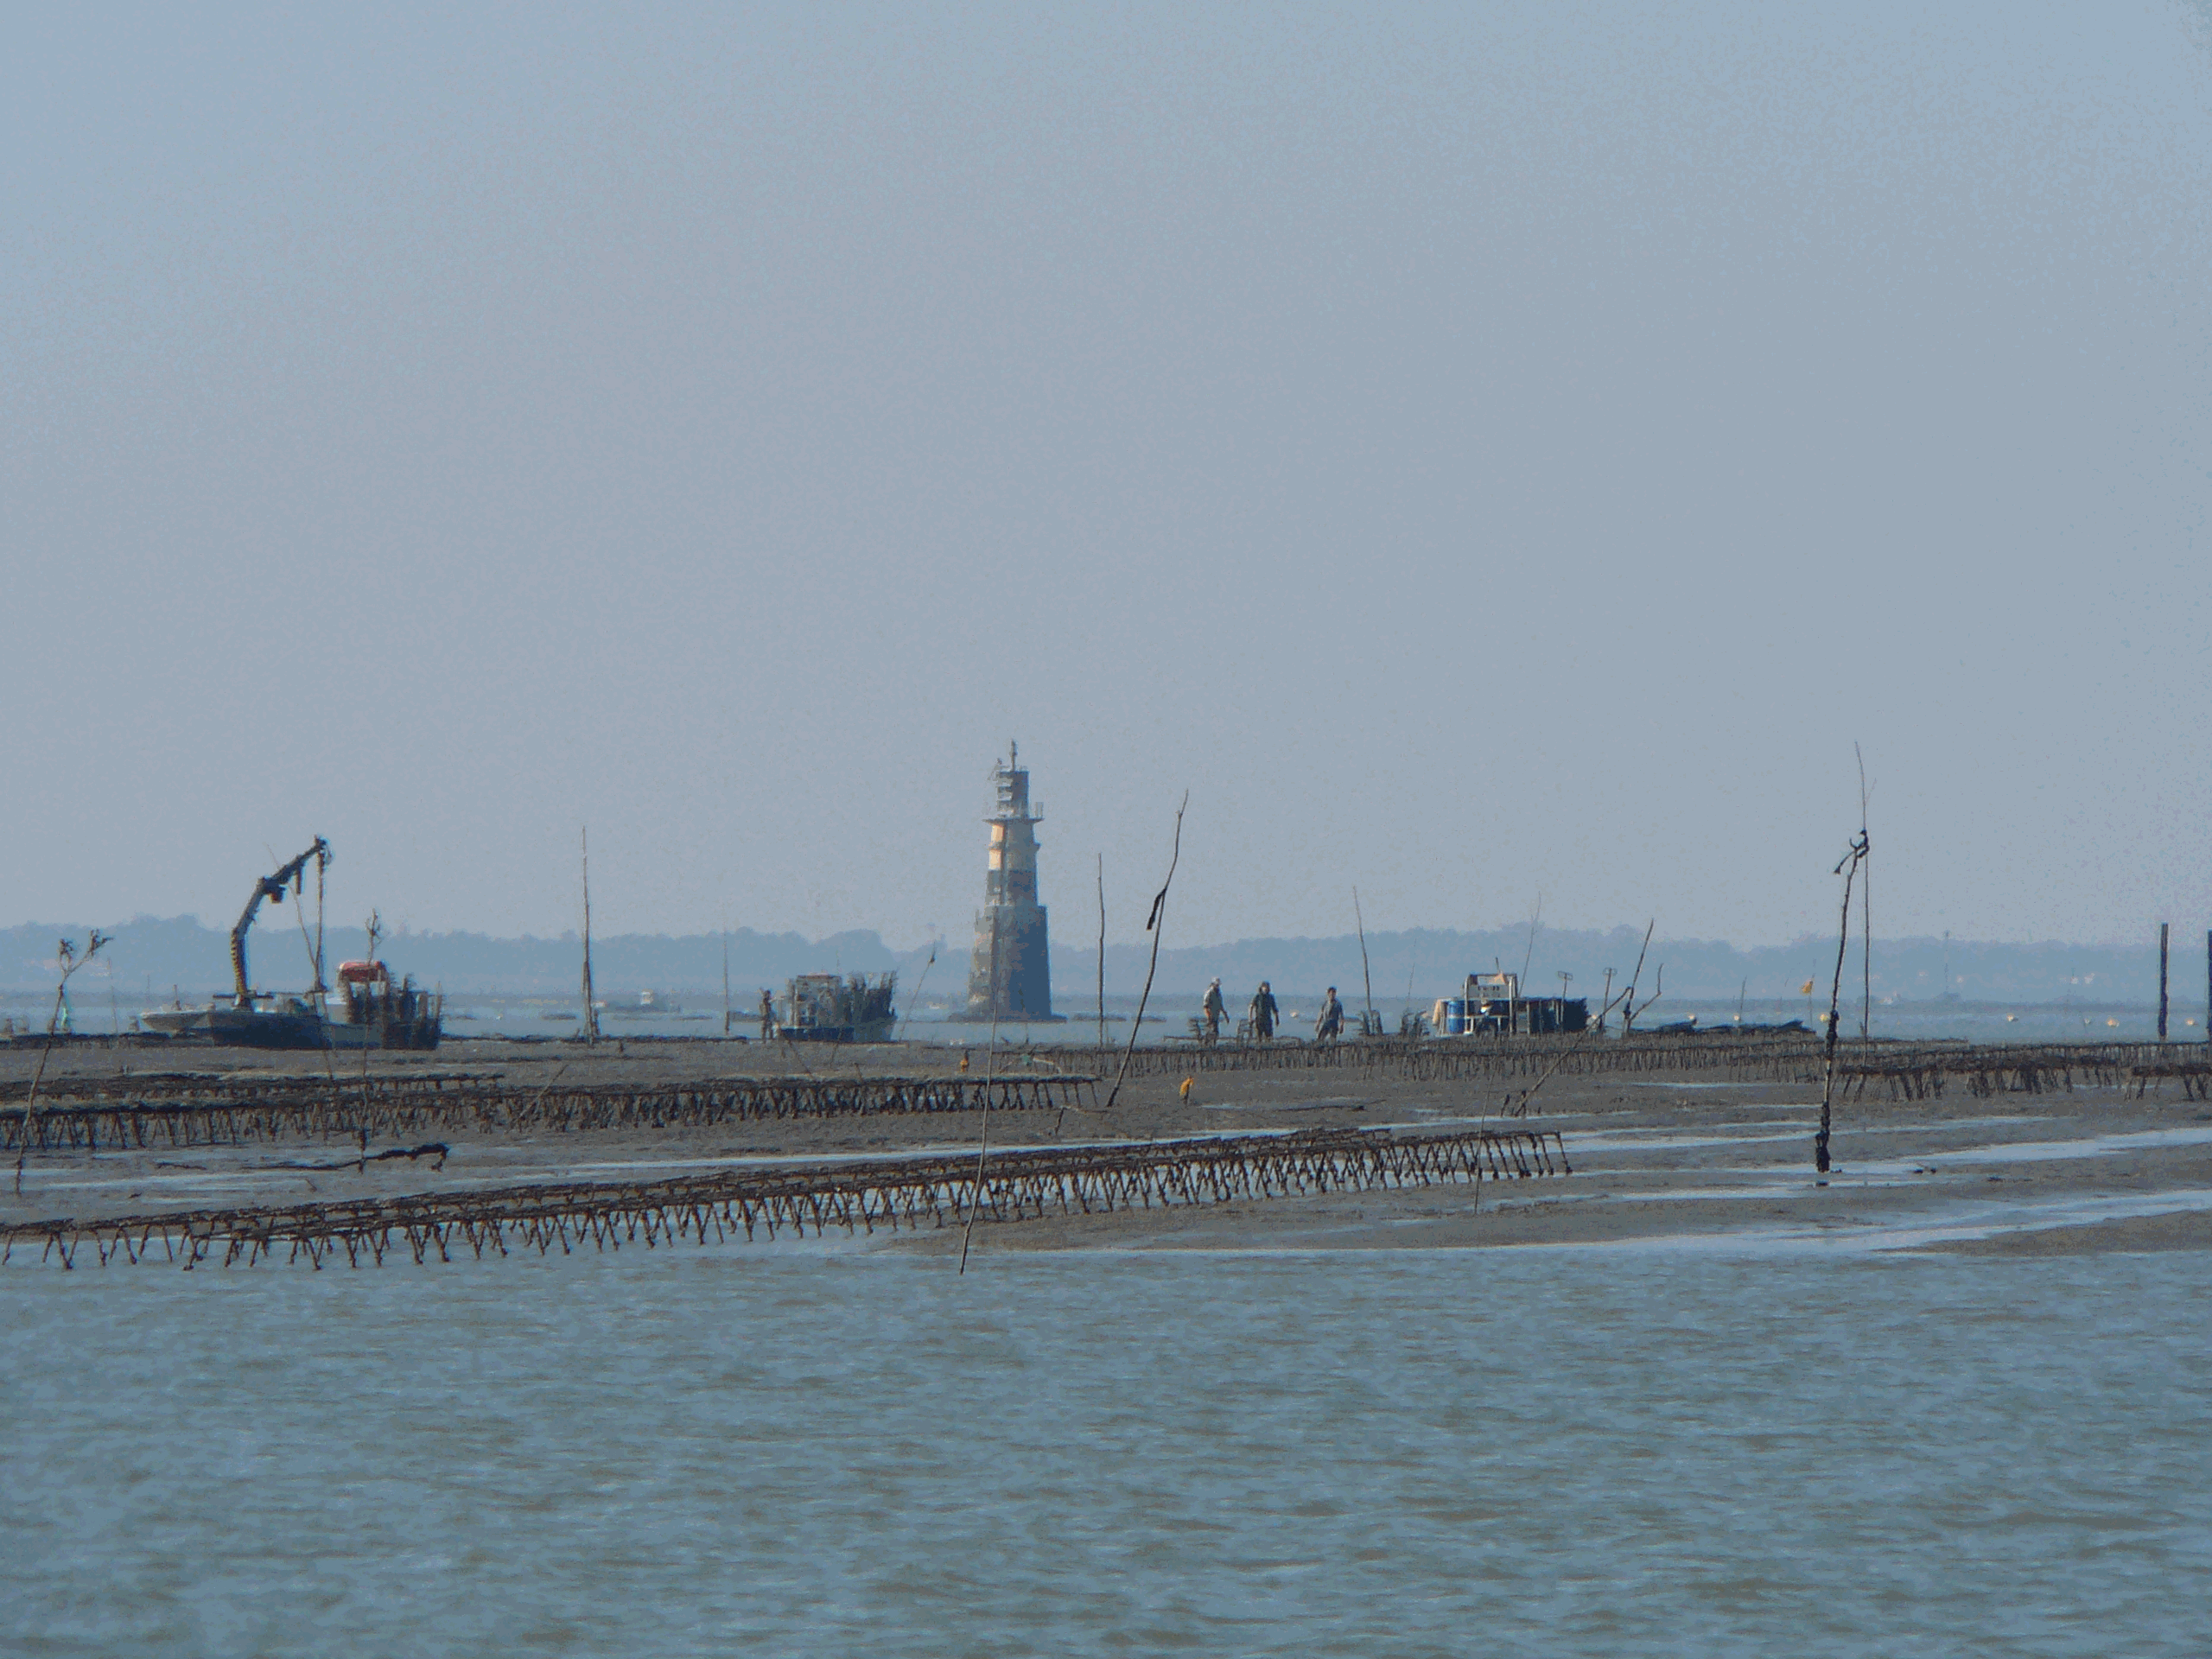
Data were collected from the regional program LOUPE (Observation of the habitat and associated communities in the context of the fisheries of the Capbreton Canyon). It consisted in the observations of two métiers practiced around the canyon. The observations were carried out between July 2011 and April 2013 on coastal boats. Observations and interviews were made on board commercial vessels. The longlines used in the hake fishery are semi-pelagic and are deployed on the edge of the Capbreton Canyon. It is an emblematic and major métier benefiting from a particular regulation as they take advantage of a prohibition of net and trawl fishing on their fishing grounds. Between 8 and 14 costal boats practice this métier during the year and the fleet characteristics are homogeneous. Boats lay between 1,200 and 1,800 hooks per day, baited with frozen pilchard (Sardina pilchardus). Two or three men are on board these vessels. Fishing is mostly practiced in spring and summer but a small number of vessels work all year. Generally, trips last between ten and twelve hours; longline is set before sunrise and retrieved three or four hours later. Hake is the main targeted species; other targets are pollack (Pollachius pollachius), red sea bream (Pagellus bogaraveo) and conger (Conger conger). Netting is a major métier in terms of vessels involved and the number of trips. Crew composition varies and depends on boat length (from one to four men on average). This métier is practiced by 30 to 35 boats all year round, but fleet characteristics are less homogeneous than in the case of longliners . The strategy of these netters operating in the coastal area is based on the use of several types of nets (gillnets and trammel nets) targeting several species, often sold directly to consumers on the docks. Gillnets, consisting of a single mesh, target hake, sea bass and sea bream species (Diplodus spp, Sparus aurata, Litognathus mormyrus), while the trammel nets (three meshes) are used to capture benthic fish, such as common sole, monkfish (Lophius spp), turbot and brill (Scophthalmus rhombus). Generally, trips last less than twelve hours for coastal netters (less than 15 m), which predominate in the sector, and a few days for large netters. On average, the coastal vessels set 6000 to 8000 m. nets daily.
-
Long-term time series of coliform bacteria concentration (fecal coliform or Escherichia coli) in shellfish in four submarine areas (North Sea/Channel, Britany, Atlantic, Mediterranean).
-
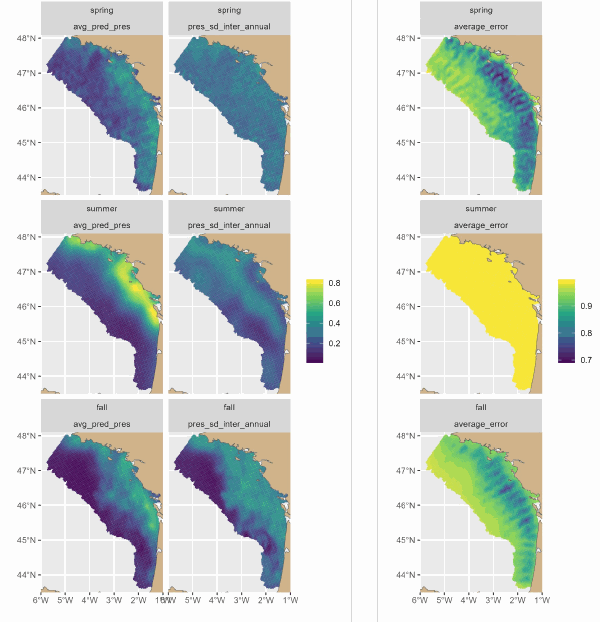
The Delmoges project aims to generate new ecological and fisheries knowledge to reduce dolphin bycatch in the Bay of Biscay (GoG). This dataset presents maps produced by a hierarchical model of the seasonal and interannual distribution of dolphins' main prey, small pelagic fish. The model integrates 3 types of data: presence-absence and biomass of fish from scientific campaigns and presence of fish from fishing data. For the first time, the model has provided a quantitative description of the seasonal spatial dynamics of sardines and associated fisheries. The main sardine distribution areas were coastal, from the mouth of the Gironde to south-west Brittany. On average, sardines were distributed over a wider area in small aggregations in spring. They seemed to concentrate in their main distribution areas in summer, and to disperse offshore in autumn, but to a lesser extent than in spring. Fishing was concentrated in the sardine's main coastal distribution areas, and was more intense in summer, then autumn, and less intense in spring.
-
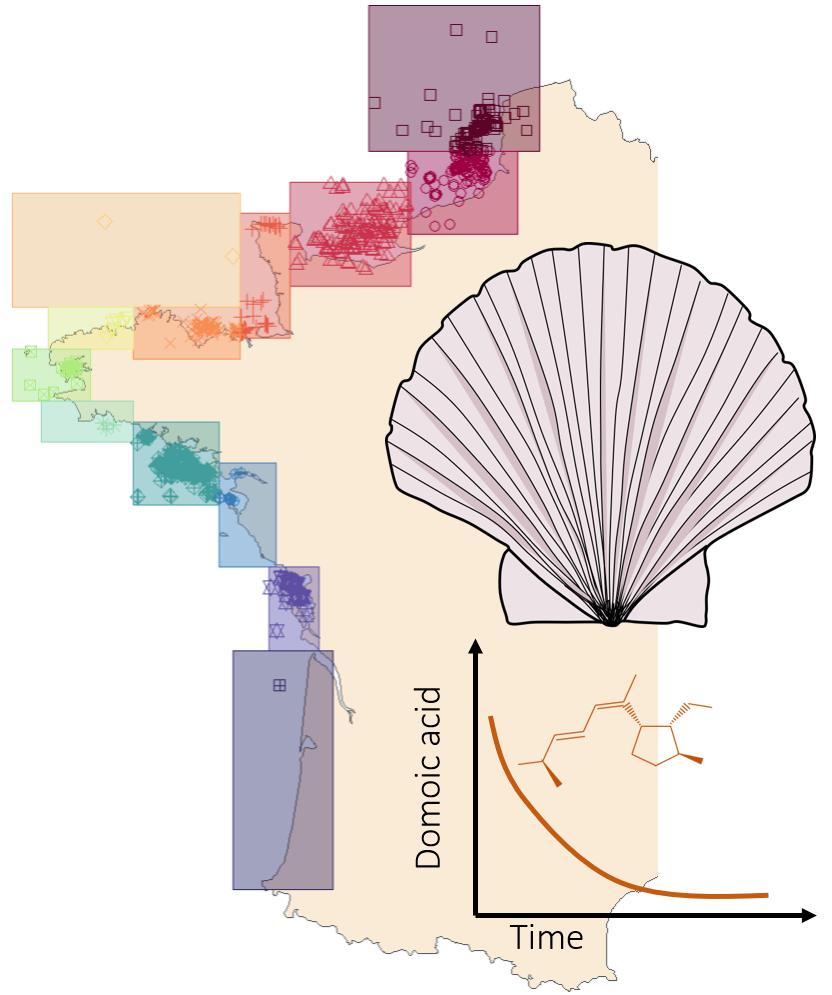
In the context of contamination of shellfish species by domoic acid produced by microalgal species of the genus Pseudo-nitzschia, we studied the particular case of depuration kinetics of king scallops, Pecten maximus. The study was based on the REPHYTOX dataset (https://doi.org/10.17882/47251) which includes, among others, long-term time series of domoic acid in shellfish species. We selected only the locations along the English Channel and the Atlantic coastline. Contamination events were defined for each locations, depuration rates were estimated fitting an exponential decay model using a non-linear least squares regression. Spatio-temporal variability was assessed as well as correlations to environmental conditions, using REPHY dataset (https://doi.org/10.17882/47248). Finally, scenarios for predictions of either the dynamics of depuration or the domoic acid contamination at a precise date were performed. Four files are available as data used for the study and results : (i) subset of REPHYTOX dataset, (ii) subset of REPHY dataset, used in this study and (iii) contamination event information (i.e., initial and end date of the event, initial domoic acid concentration) and depuration rate estimations, and (iv) predictions of depuration dynamics with different scenarios. Information on each file is detailed in the end user manual and methodology and results are linked to an article in preparation.
-
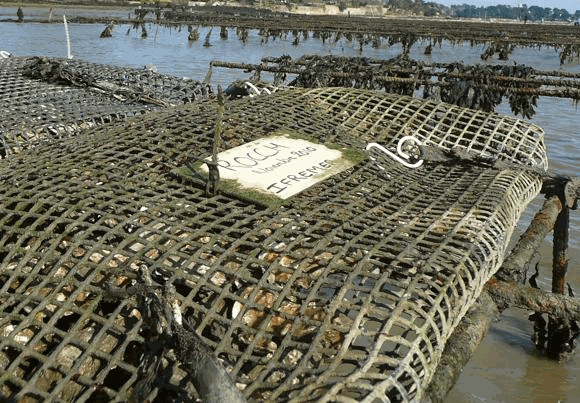
Rocch, the french "mussel watch", provides regulatory data for shellfish area quality management. Once a year, molluscs (mainly mussels and oysters) were sampled at fixed periods (currently mid-February, with a tolerance of one tide before and after the target date) on 70 to 80 monitoring stations in areas used as bivalve molluscs production. For each monitoring station, molluscs are collected in wild beds or facilities, ensuring a minimum stay of 6 months on-site before sampling. The individuals selected are adults of a single species and uniform size (30 to 60 mm long for mussels, 2 to 3 years old for oysters, and commercial size for other species). A minimum of 50 mussels (and other species of similar size) or 10 oysters is required to constitute a representative pooled sample. Lead, mercury, cadmium, PAHs, PCBs, dioxins and, since 2023, regulated PFASs are analysed in molluscs tissues.
-
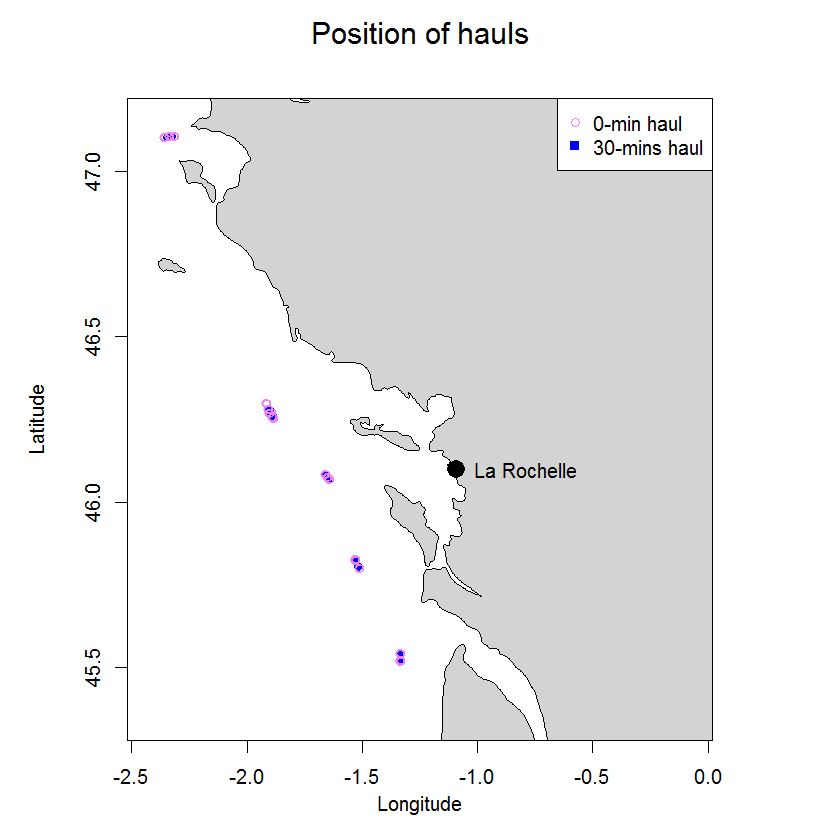
In 2003 two experiments were carried out in the Bay of Biscay to compare catch numbers obtained in standard research 30-min hauls with those from 0-min hauls to determine the so called end effect. The end effect in trawl catches is defined as the proportion of the fish catch taken during shooting and hauling of the net, a period excluded from what is nominally referred to as haul duration. In 0-hauls the trawl was hauled as soon as the trawl geometry stabilized on the seabed. The trawl used was a beam trawl rigged as twin trawl. Overall 24 hauls were carried out, six 30-min and 18 0-min hauls. Average catch ratios (0-min/30-min hauls) ranged from 0.05 (s.d. 0.06) for sole to 0.34 (s.d. 0.64) for hake.
-
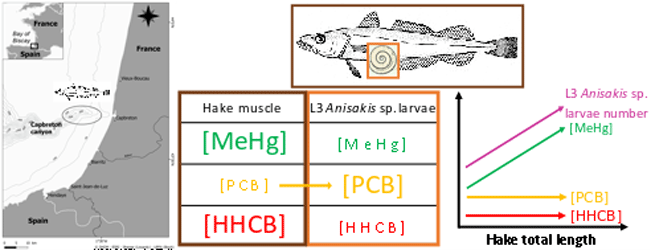
This dataset gathers isotopic ratios (carbon and nitrogen) and concentrations of both priority (mercury species and polychlorinated biphenyls congeners) and emerging (musks and sunscreens) micropollutants measured in a host-parasite couple (hake Merluccius merluccius muscle and in its parasite Anisakis sp) from the south of Bay of Biscay in 2018. In addition, the hake infection degree measured as the number of Anisakis sp. larvae was added for each hake collected.