 Catalogue PIGMA
IR-ARGO
Type of resources
Available actions
Topics
Keywords
Contact for the resource
Provided by
Years
Formats
Representation types
Update frequencies
status
Scale
-
The continuously updated version of Copernicus Argo floats realtime currents product is distributed from Copernicus Marine catalogue: - https://resources.marine.copernicus.eu/?option=com_csw&view=details&product_id=INSITU_GLO_UV_NRT_OBSERVATIONS_013_048 The Argo current product generated by Copernicus in situ TAC is derived from the original trajectory data from Argo GDAC (Global Data Assembly Center) available at: - Argo float data and metadata from Global Data Assembly Centre (Argo GDAC). SEANOE. https://doi.org/10.17882/42182 In 2021, the GDAC distributes data from more than 15,000 Argo floats. Deep ocean current is calculated from floats drift at parking depth, surface current is calculated from float surface drift. An Argo float drifts freely in the global ocean, performing regular observation cycles. An observation cycle usually spreads over 10 days : - a surface descent to a parking depth (generally 1500 meters deep) - a 10-day drift at this parking depth - an ascent to the surface (vertical profile) - A short surface drift for data transmission The data transmitted at each cycle contain temperature, salinity observations (and additional biogeochemical parameters if applicable), positions (gps or argos), technical data. The ocean current product contains a NetCDF file for each Argo float. It is updated daily in real time by automated processes. For each cycle it contains the surface and deep current variables: - Date (time, time_qc) - Position (latitude, longitude, position_qc) - Pressure (pres, pres_qc, representative_park_pressure for parking drift, 0 decibar for surface drift) - Current (ewct, ewct_qc, nsct, nsct_qc; the current vector is positioned and dated at the last position of the N-1 cycle) - Duration (days) of the current variable sampling (time_interval) - Grounded indicator - Positions and dates have a QC 1 (good data). Positions and dates that do not have a QC 1 are ignored. The positions are measured during the surface drift (Argos or GPS positioning). For the deep current of cycle N, we take the last good position of cycle N-1 and the first good position of cycle N. For the surface current of cycle N, we take the first and last good position of the N cycle.
-
A world deep displacement dataset, named ANDRO, after a traditional dance of Brittany meaning a swirl, comprising more than 1300 000 deep displacements, has been produced from the Argo float trajectory data ('traj' files). ANDRO dataset was completed over the period 2000-2009, then was partially but yearly updated since 2010. For detailed information and status of the last released ANDRO product, please visit the dedicated Argo France web page: https://www.umr-lops.fr/SNO-Argo/Products/ANDRO-Argo-floats-displacements-Atlas One important feature of ANDRO is that the pressures measured during float drifts at depth, and suitably averaged are preserved in ANDRO. To reach this goal, it was necessary to reprocess most of the Argo raw data, because of the many different decoding versions (roughly 100) not always applied by the DACs to the displacement data because they were mainly interested in the p,t,S profiles. The result of our work was the production of comprehensive files, named DEP (for 'déplacement' in French), containing all the possibly retrievable float data.
-
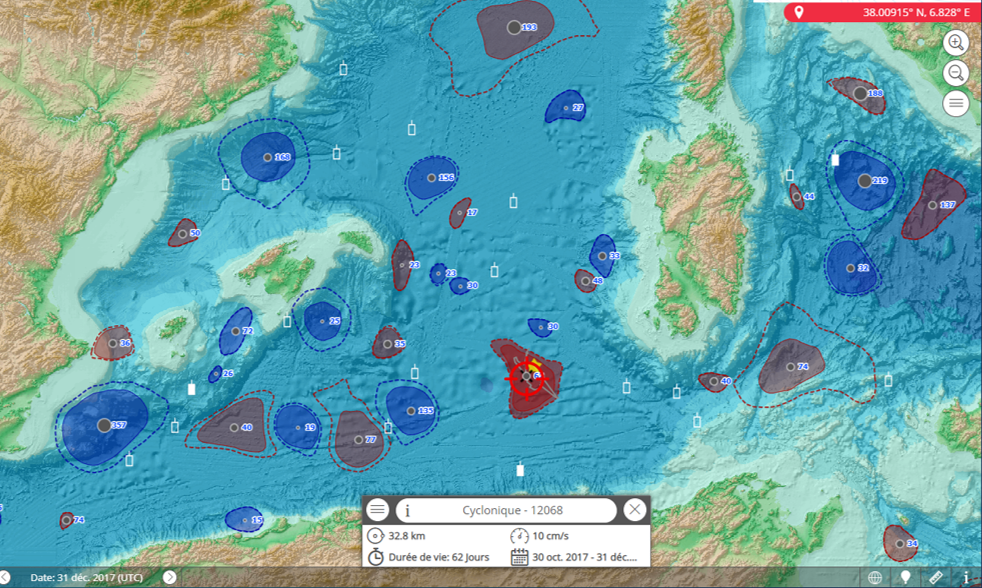
Eddies detected in Delayed-Time (DT) for the entire period [1993 - present]. Variables provided include day-by-day, and for one rotation type (Cyclonic/Anticyclonic) : - Center position (Longitude and latitude of the center of the best fit circle with the contour of maximum circum-average geostrophic speed); - Amplitude (|SSH(local_extremum) – SSH(outermost_contour)|); - Speed radius (Radius of the best fit circle with the contour of maximum circum-average geostrophic speed); - Speed average (Average geostrophic speed of the contour defining the speed radius); - Speed profile (Profile speed average values from effective contour inwards to smallest inner contour); - Effective contour (Largest contour of the detected eddy); - Speed contour (Contour of maximum circum-average geostrophic speed for the detected eddy).
-
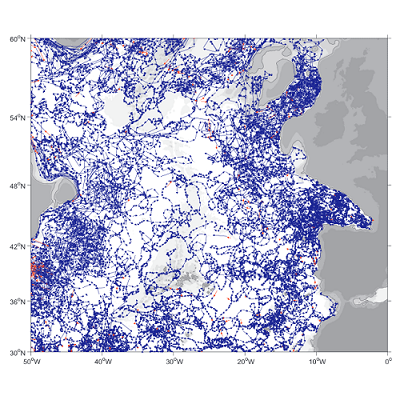
A world deep displacement dataset comprising more than 1600 000 Argo floats deep displacements, has been produced from the global Argo float database (GDAC). ANDRO dataset was completed over the period 2000-2009, then was partially but yearly updated since 2010. ANDRO actual contents and format is described in the user guide, which must be carefully read before using ANDRO (ANDRO format is also described in Ollitrault M. et al (2013)). One important feature of ANDRO is that the pressures measured during float drifts at depth, and suitably averaged are preserved in ANDRO (see Figure 2). To reach this goal, it was necessary to reprocess most of the Argo raw data, because of the many different decoding versions (roughly 100) not always applied by the DACs to the displacement data because they were mainly interested in the p,t,S profiles. The result of our work was the production of comprehensive files, named DEP (for déplacements in French), containing all the possibly retrievable float data. For detailed information and status of the last released ANDRO product, please visit the dedicated Argo France web page: https://www.umr-lops.fr/SNO-Argo/Products/ANDRO-Argo-floats-displacements-Atlas
-
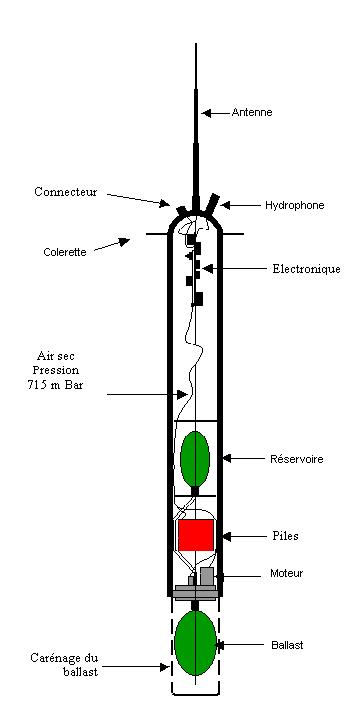
The RAFOS float technique (the reverse acronym of SOund Fixing And Ranging) is used to obtain sub-surface trajectories of floats by acoustic location. These floats are immersed at a constant depth and drift with the body of water in which they are immersed. The floats record the arrival time of the sound signals emitted by a network of fixed acoustic sources placed on moorings. They regularly come to the surface to transmit the data that they have recorded.
-

Argo est un programme international qui organise la collecte des paramètres de l’océan intérieur à l'aide d'une flotte d'instruments robotisés. Ces instruments, les flotteurs profileurs, dérivent avec les courants océaniques et se déplacent à la verticale entre la surface et 2000m, 4000m ou le fond des océans. Les données recueillies par Argo décrivent la température et la salinité de l'eau et certains flotteurs mesurent d'autres propriétés qui décrivent la biologie/chimie de l'océan. La principale raison de la collecte de ces données est de mieux comprendre le rôle des océans dans le climat de la Terre et d'être ainsi en mesure d'améliorer les estimations de son évolution future. La ir* Euro-Argo (Très Grande Infrastructure de Recherche) regroupe la composante nationale Argo France et la contribution française à la coordination de l’ERIC Euro-Argo. L’ERIC (European Research Infrastructure Consortium) Euro-Argo est la contribution européenne au réseau international Argo.
-
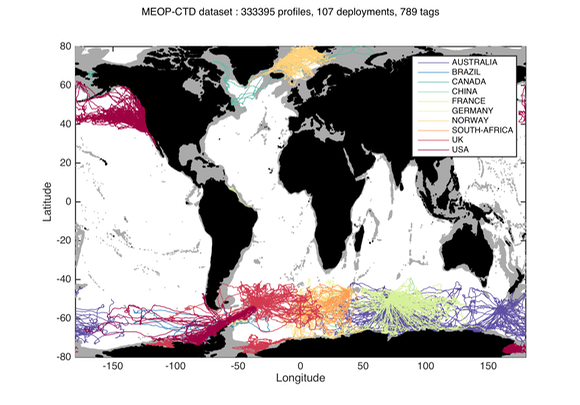
Since 2004, several hundred seals have been equipped with conductivity-temperature-depth (CTD) sensors in the Southern Ocean for both biological and physical oceanographic studies. A calibrated collection of seal-derived hydrographic data is now available from Coriolis, currently consisting of more than 300,000 temperature/salinity profiles. Delayed mode data, December 2014 https://doi.org/10.12770/0a82d60c-683d-47b8-8bd1-24933ec24983 on the Coriolis ftp server, in /ifremer/marine_mammals/. In a near future (summer 2015), seal data will be updated daily, and a monthly snapshot of the full database will be produced. through the Coriolis data selection tool (Sea mammal or Animal profiles).
-
This dataset provides a World Ocean Atlas of Argo inferred statistics. The primary data are exclusively Argo profiles. The statistics are done using the whole time range covered by the Argo data, starting in July 1997. The atlas is provided with a 0.25° resolution in the horizontal and 63 depths from 0 m to 2,000 m in the vertical. The statistics include means of Conservative Temperature (CT), Absolute Salinity, compensated density, compressiblity factor and vertical isopycnal displacement (VID); standard deviations of CT, VID and the squared Brunt Vaisala frequency; skewness and kurtosis of VID; and Eddy Available Potential Energy (EAPE). The compensated density is the product of the in-situ density times the compressibility factor. It generalizes the virtual density used in Roullet et al. (2014). The compressibility factor is defined so as to remove the dependency with pressure of the in-situ density. The compensated density is used in the computation of the VID and the EAPE.
-
This dataset contains bio-optical measurements from BioGeoChemical-Argo (BGC-Argo) profiling floats complemented with ocean-colour satellite matchups of variables related to the detection of coccolithophore blooms dominated by Emiliania huxleyi. BGC-Argo float data cover the global ocean from November 2012 to December 2018 and include measurements of the particulate backscattering coefficient (BBP_float in m-1), the concentration of Chlorophyll-a (CHLA_float in mg m-3), and the particulate beam attenuation coefficient (CP_float in m-1) with data processing and quality control described in the manuscript entitled “Detection of coccolithophore blooms with BioGeoChemical-Argo floats” submitted to Geophysical Research Letters. The data represent near-surface ocean conditions, calculated as the average value in the top 15m of the water column. Daily ocean-colour satellite data were downloaded from the GlobColour project (ftp://ftp.hermes.acri.fr) with a spatial resolution of 4km and matched with every BGC-Argo float observation by using a 5x5 pixel box and a 9-day temporal window. For each float observation, we extracted concurrent satellite data of the concentrations of Particulate Inorganic Carbon (PIC_sat in mmol m-3) and Particulate Organic Carbon (POC_sat in mmol m-3), from which we derived the proportion of PIC_sat to the total particulate carbon concentration (PIC_POC_sat in % and defined as PIC_sat / [PIC_sat+POC_sat]). Coccolithophore bloom periods were identified using annual times series of PIC_sat and PIC_POC_sat at each profile location as described in the submitted manuscript, and the column “inside_coccolithophore_bloom” reports the float observations occurring inside such blooms.
-
The presented database includes 0-1000 m vertical profiles of bio-optical and biogeochemical variables acquired by autonomous profiling Biogeochemical-Argo (BGC-Argo) floats. Data have been collected between October 2012 and January 2016, around local noon, in several oceanic areas encompassing the diversity of ocean’s trophic environments. The database includes profiles of downward irradiance at 3 wavelengths (380, 412 and 490 nm), photosynthetically available radiation, chlorophyll a concentration, fluorescent dissolved organic matter, and particle light backscattering at 700 nm. All variables have been quality controlled following specifically-developed procedures, that aimed to support biogeochemical and bio-optical applications at the global scale. Data corruption by biofouling and any instrumental drift has also been verified. Moreover, to allow users for different biogeochemical applications, vertical profiles of chlorophyll a and particle light backscattering at 700 nm have been presented before and after advanced processing (e.g., non-photochemical quenching correction, identification of spikes). Vertical profiles of temperature and salinity associated to these bio-optical data are also provided although they have been only quality-controlled for sensor issues related to bio-fouling and instrumental drift.