 Catalogue PIGMA
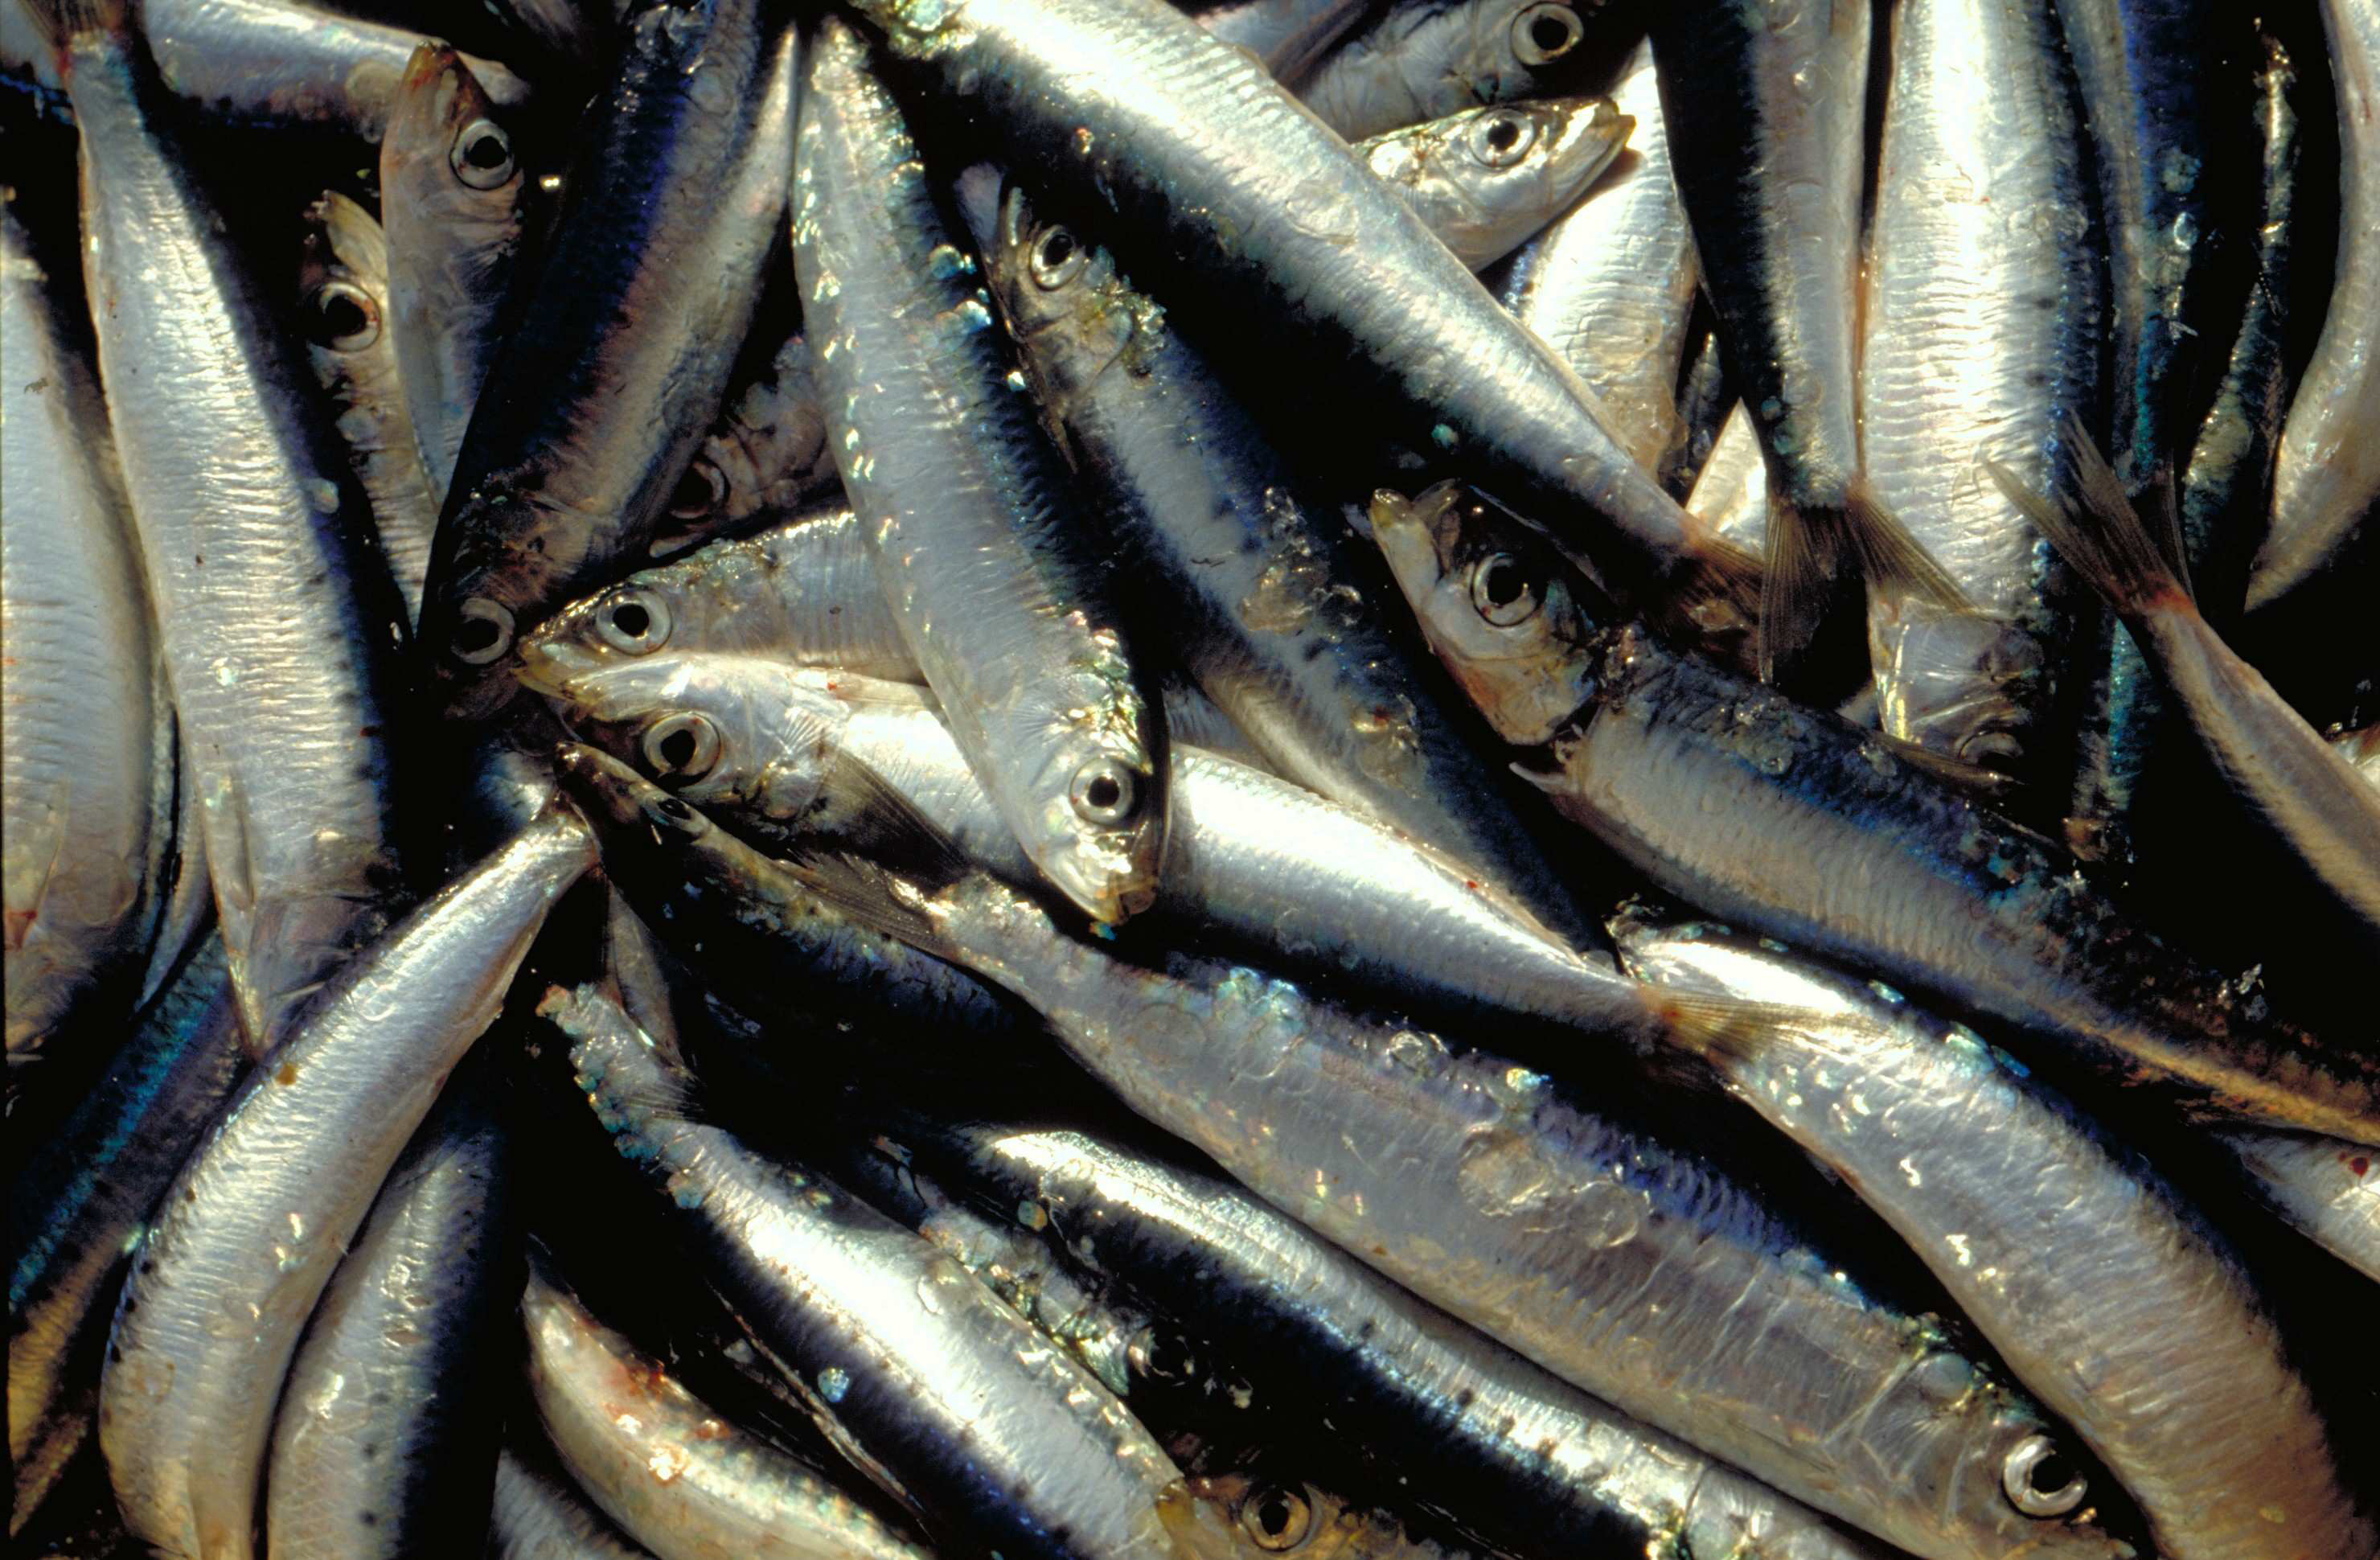
Sardine
Type of resources
Available actions
Topics
Keywords
Contact for the resource
Provided by
Years
Formats
Update frequencies
status
-
The anchovy (Engraulis encrasicolus) and sardine (Sardina pilchardus) populations in the Bay of Biscay are jointly surveyed each year in May since 2000 and in September since 2003 by means of acoustic surveys. The integrated survey PELGAS (Doray et al., 2018) is run in May by France and covers the French shelf of the Bay of Biscay. Its objectives are to monitor the Bay of Biscay pelagic ecosystem in springtime and assess the biomass of its small pelagic fish species, including sardine and anchovy. Amongst many information on the ecosystem, the survey PELGAS provides knowledge on the adults of anchovy and sardine during their spawning in spring. The survey JUVENA (Boyra et al., 2013) is run in September by Spain. It has a larger spatial coverage than PELGAS, including part of the Spanish coast and open ocean outside the shelf because it targets juvenile anchovy. It also provides knowledge on sardine as well as other pelagic species. Both surveys are coordinated by the ICES Working Group on Acoustic and Egg Surveys for Small Pelagic Fish (WGACEGG), together with other pelagic surveys in ICES areas 7, 8 and 9. Survey protocoles are detailed in Doray et al. (2021). Briefly, fish backscatter data are recorded along the survey transect lines and pelagic trawl hauls are undertaken opportunistically to identify the echotraces to species and collect fish samples for biometric data. The trawl haul catches have provided the anchovy and sardine length data, from which the maps presented here are derived. At each trawl haul, the catch is sorted by species and weighted. A subsample by species is measured to estimate the species’ length distribution. The four maps presented here correspond to the average maps of anchovy and sardine length distributions in May and September, derived from the PELGAS and JUVENA trawl haul data series. The maps were obtained by kriging, following the procedure explained in Petitgas et al. (2011) for mapping functions instead of variables. For each species, the experimental length distribution at each haul was fitted by a linear combination of Legendre polynomials, the coefficients of which were co-kriged. The number of polynomials varied from 15 to 22 depending on the survey and species, with a higher number for sardine and in autumn. The length histogram at each grid node was then deduced from the mapped coefficients. When the length distribution at a given haul was estimated with less than 40 individual fish, the haul was not taken into account for mapping. This threshold defined presence and absence of the species in the haul data sets. The trawl hauls from 2000 to 2019 were pooled for the PELGAS series (1965 stations) and from 2003 to 2020 for JUVENA (852 stations). The mapping was performed on the same grid for both PELGAS and JUVENA and both species, and with similar moving kriging neighbourhoods. The grid has a mesh size of 0.25 x 0.25 decimal degree square. In addition to mapping the length distribution, presence/absence was mapped for each species by ordinary kriging on the same grid and with the same neighbourhoods as previously. The computations were performed in R (version 4.0.5) with the RGeostats package (version 13.0.1) freely available at http://rgeostats.free.fr. The map data files comprise for each species the following information: the geographical coordinates of the grid points, the probability of presence and the probability of each length class of width 0.5 cm ranging from 2.5 to 27 cm.
-
This dataset comprises energy density and proximal composition (water, ash, lipid and protein contents) for anchovy (Engraulis encrasicolus) and sardine (Sardina pilchardus) from the Bay of Biscay, the English Channel and the southern North Sea between 2014 and 2017. Fish were sampled throughout various seasons thanks to the PELGAS (May, Bay of Biscay), EVHOE (October-November, Bay of Biscay), CGFS and CAMANOC (September-October, English Channel) surveys conducted by IFREMER on the RV “Thalassa”, to the JUVENA (September-October, Bay of Biscay) survey conducted by AZTI, and from commercial landings within the European Data Collection Framework (DCF) during the CAPTAIN project (France Filière Pêche). During the surveys, pelagic (PELGAS and JUVENA) or demersal (EVHOE and CGFS) trawl hauls are undertaken to identify species and measure individual fish traits. Professional sampling was performed from pelagic trawl or purse-seine catches. From the various surveys, a sub-sampling of the trawls was performed to cover as much as possible the spatial extent of the surveys along the french coast. From the various selected trawls, a sub-sampling of 5 fish per size class (when possible) was performed to cover the size range of each species, based on the following size classes : sardine (1 : <15 cm ; 2 : 15-20 cm ; 3 : >20cm), anchovy (1 : <10cm ; 2 : 10-14 cm ; 3 : >14cm). Each fish was individually measured to the nearest tenth of a centimeter and weighted to the nearest tenth of a gram. These measurements were taken either at sea or later in the laboratory. The collected fish were frozen individually at -20°C before laboratory processing. In the laboratory, maturity stages were determined following ICES guidelines (ICES, 2008) based on macroscopic gonads observation and using a six-stage key as follows: stages 1 & 2 indicate immature and developing individuals, stages 3–5 indicate three steps of increasing gonad development and the spawning period (stage 3: partial pre-spawning; stage 4: spawning (hydrated); stage 5: partial post-spawning), and stage 6 features the final post-spawning period. Fish characterised by maturity stages 3, 4 or 5 were considered as being in an active reproductive period as opposed to fish in stages 1, 2 or 6. Fish were then ground and freeze-dried during at least 48 hours. Water content of the entire fish was determined from dry mass and wet mass ratio. Then, fish were ground again to obtain fine homogeneous dry powder for subsequent analysis. Energy density measurements were performed following the protocols of Gatti et al. (2018). Two subsamples of fish powder were placed in an adiabatic bomb calorimeter (IKA C-4000 adiabatic bomb calorimeter, IKA-WerkeGmbh & co. KG) for energy measurements. The energy density (ED, kJ.g-1 dry mass) was determined by measuring the heat released through the combustion of a small subsample, approximately 200 mg. If the coefficient of variation between the two measurements exceeded 3%, a third measurement was made. Finally, ED subsamples measurements were averaged and assigned to each individual fish. Energy density analyses were conducted on 503 individuals for anchovy and 976 individuals for sardine. Ash content was determined gravimetrically by combusting dried tissue in a muffle furnace at 550°C for six hours. Lipids and proteins were analysed by a certified laboratory (Labocea, Plouzané, France). Protein content was estimated using the Kjeldahl method. It consists in first determining the quantity of nitrogen contained in the sample, and to convert it into protein content using a conversion factor (6.25 here). Lipid content was determined by hydrolysis, using petroleum ether as an organic solvent. Carbohydrates represent less than 1% of fish mass and were thus neglected. Protein, lipid and ash content did not exactly sum to 1 in DW (anchovy: mean = 0.91, sd = 0.04; sardine: mean = 0.90, sd = 0.04). This discrepancy may arise from residual water, measurement uncertainties, or to a lesser extent the exclusion of carbohydrates. Body component contents have been normalised by dividing each component by the sum of lipids, proteins and ash content, to sum to one, enabling comparisons between fishes, assuming proportional errors across the components. A total of 116 and 104 proximate composition analyses were performed for anchovy and sardine, respectively.
-
The data sets presented here result from the long-term monitoring of individual growth patterns in anchovy and sardine in the Bay of Biscay, from 2000 to 2018. They derived from the PELGAS survey series (Doray et al., 2018), which monitors annually the Bay of Biscay pelagic ecosystem since 2000. The survey is performed in May during the peak spawning of anchovy and main spawning of sardine. Among the many data collected, anchovy and sardine populations are assessed by combining acoustic records with pelagic trawl hauls catches and ICES survey protocoles are used, as detailed in Doray et al. (2021). Briefly, fish acoustic backscatter are recorded along survey transect lines and pelagic trawl hauls undertaken opportunistically to identify echotraces to species and collect fish samples for acquiring biometric data. At each trawl haul and for each species, a random subsample of individuals is taken to establish the species’ length distributions. For anchovy and sardine, this subsample is further subsampled, spanning the whole length range, to take individual fish measurements. These amount to extracting otoliths and measuring individuals’ age, length, weight, sexual maturity and other parameters. Individual measurements are taken on fourty individuals of anchovy and sardine when the species are present in the catch. For each individual fish, the two otolith sagittae are extracted on board, mounted in leukit for age reading on board when permitting and/or on land in the laboratory. Growth patterns in the otoliths were analysed on land with a binocular stereomicroscope under reflected natural light. For anchovy, otoliths’ growth was measured for all individuals in all the hauls. For sardine, trawl hauls were selected and all individual otoliths were measured in each selected haul. The selection was made using the geographical stratification defined in Petitgas et al. (2018) based on the ecosystem spatial structure. An average of two to three hauls in each of the four strata were selected per year. The otoliths mounted in leukit were imaged and growth-at-age in the otoliths was measured with the software TNPC (Traitement numérique des pièces calcifiées: Mahé et al., 2009). Under the binocular microscope and natural light, the otoliths showed hyaline (aragonite-poor) rings corresponding to winter periods of low growth and between the rings, white opaque (aragonite-rich) portions corresponding to annual growth periods. The annual ring determination, the age assignment and the measurement of annual ring diameters followed ICES protocoles and guidelines for anchovy and sardine (ICES, 2010; 2011). The age was estimated as the number of hyaline rings. If the edge was hyaline, it was counted as a ring as a hyaline edge observed within the first half of the year is assumed to represent the last winter. The diameter of each annual ring was measured from middle of the hyaline ring on one side to the middle of the ring on the opposite side along the major elongated axis of the otolith and passing through its centre. The distance was expressed in mm after calibration of the stereomiscroscope and the pixel images. Such diameter corresponded to growth-at-age. Ages 0 to 4 were considered (diameters R1 to R5). The total diameter of the otolith was also measured. The data sets span 19 years, from 2000 to 2018 and comprise 20,186 and 8,624 individual fish analyzed at 535 and 235 trawl hauls for anchovy and sardine, respectively. These data sets were used by Boëns et al. (2021 and 2023) to analyse changes in growth patterns and growth-selective mortality at age in anchovy and sardine under environmental and fishing pressures. References: Doray, M., Boyra, G. and Van Der Kooij, J. (eds) (2021). ICES Survey Protocols – Manual for acoustic surveys coordinated under ICES Working Group on Acoustic and Egg Surveys for Small Pelagic Fish (WGACEGG). 1st Edition. ICES Techniques in Marine Environmental Sciences, 64. https://doi.org/10.17895/ices.pub.7462 Doray, M., Petitgas, P., Romagnan, J.-B., Huret, M., Duhamel, E., Dupuy, Ch., Spitz, J., Authier, M., Sanchez, F., Berger, L., Doremus, G., Bourriau, P., Grellier, P. and Masse, J. (2018). The PELGAS survey: ship-based integrated monitoring of the Bay of Biscay pelagic ecosystem. Progress In Oceanography, 166, 15-29. https://doi.org/10.1016/j.pocean.2017.09.015 ICES (2010). Report of the Workshop on Age reading of European anchovy (WKARA), 9-13 November 2009, Sicily, Italy. ICES CM 2009/ACOM: 43. 122 pp. https://doi.org/10.17895/ices.pub.19280525 ICES (2011). Report of the Workshop on Age Reading of European Atlantic Sardine (WKARAS), 14-18 February 2011, Lisbon, Portugal. ICES CM 2011/ACOM:42. 91 pp. https://doi.org/10.17895/ices.pub.19280855 Petitgas, P., Huret, M., Dupuy, Ch., Spitz, J., Authier, M., Romagnan, J.-B. and Doray, M. (2018). Ecosystem spatial structure revealed by integrated survey data. Progress In Oceanography, 166, 189-198. https://doi.org/10.1016/j.pocean.2017.09.012 Mahe, K., Bellail, R., Dufour, J.-L., Boiron-Leroy, A., Dimeet, J., Duhamel, E., Elleboode, R., Felix, J., Grellier, P., Huet, J., Labastie, J., Le Roy, D., Lizaud, O., Manten, M.-L., Martin, S., Metral, L., Nedelec, D., Verin, Y. and Badts, V. (2009). Synthèse française des procédures d'estimation d'âge / French summary of age estimation procedures. https://archimer.ifremer.fr/doc/00000/7294/ Boëns, A., Grellier, P., Lebigre, Ch. and Petitgas, P. (2021). Determinants of growth and selective mortality in anchovy and sardine in the Bay of Biscay. Fisheries Research, 239, 105947. https://doi.org/10.1016/j.fishres.2021.105947 Boëns, A., Ernande, B., Petitgas, P. and Lebigre, Ch. (2023). Different mechanisms underpin the decline in growth of anchovies and sardines of the Bay of Biscay. Evolutionary Applications, 16: 1393–1411. https://doi.org/10.1111/eva.13564
-
La campagne annuelle d'évaluation des ressources halieutiques PELMED (PELagiques MEDiterranée) est menée par le Laboratoire Halieutique Méditerranée de la station Ifremer de Sète. Les objectifs de ces campagnes sont : 1. Évaluer la biomasse des petits pélagiques (anchois, sardines) par méthode directe. Pour cela, la campagne doit alterner entre prospection acoustique et chalutages d'identification. Un signal acoustique est envoyé depuis un sondeur fixé sous le navire et chaque fois qu'il rencontre le fond ou des bancs de poissons, il est réfléchi et retransmis aux sondeurs. Ainsi, on peut observer en continu la forme et l'intensité de ces échos qui matérialisent les bancs de poissons. Des chalutages d'identification des espèces sont effectués afin de définir la proportion des espèces présentes dans les échos détectés. 2. Collecter le plus grand nombre de paramètres biologiques possible sur les espèces cibles de petits pélagiques (anchois, sardines, sprats) pour mieux comprendre la dynamique de population de ces espèces. Pour cela, des mesures morphométriques, ainsi que la détermination du sexe et du stade de maturité des poissons sont réalisées. Enfin, des otolithes sont prélevés afin de pouvoir déterminer l'âge des poissons. Ces paramètres biologiques sont très importants pour compléter l'évaluation de biomasse et avoir une meilleure compréhension des processus sous-jacents à la variabilité de ces populations. Cela permet par exemple de déterminer la structure en âge ou en taille des populations, d'avoir une idée de leurs réserves énergétiques, etc. 3. Mieux comprendre l'écosystème pélagique dans son ensemble, du plancton aux prédateurs supérieurs. La campagne PELMED a pour but premier d'évaluer les stocks de petits pélagiques, mais elle s'attache également à accumuler le plus de données possible sur les différents compartiments de l'écosystème pélagique, allant des paramètres physiques (température, salinité) aux prédateurs supérieurs (mammifères marins, oiseaux), en passant par les différents niveaux trophiques inférieurs (phyto- et zooplancton, poissons petits pélagiques). Ainsi, après chaque chalutage, une station hydrologique est réalisée avec la mesure de la température et de la salinité le long de la colonne d'eau via une CTD, des prélèvements d'eau et de phytoplancton avec une bouteille Niskin et des prélèvements de zooplancton à l'aide d'un trait vertical de WP2. Enfin, tout au long de la campagne nous réalisons l'observation et le comptage des oiseaux et mammifères marins. En plus de la compréhension de l'écosystème, ceci devrait permettre de fournir un certain nombre d'indicateurs nécessaires au suivi du milieu marin dans le cadre de la DCSMM (Directive Cadre sur le Milieu Marin).
-
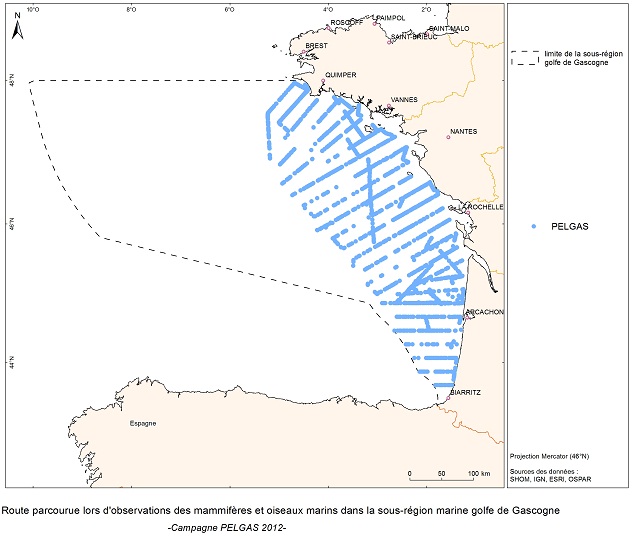
L'objectif de la campagne PELGAS est de surveiller la distribution et l'abondance des espèces pélagiques pêchées dans le golfe de Gascogne, en utilisant deux méthodes d'évaluation directe : l'acoustique et les estimations de frai. La croisière a été menée en coordination avec la France, l'Espagne et le Portugal, dans le cadre des règlements du Conseil européen (CE n° 1543/2000 du 29 juin 2000 et n° 1639/2001 du 25 juillet 2001).