 Catalogue PIGMA
WP5 Assessing state, drivers and tipping points
Type of resources
Available actions
Topics
Keywords
Contact for the resource
Provided by
Years
Formats
Representation types
Update frequencies
status
Resolution
-
Assessments run at AFWG provide the scientific basis for the management of cod, haddock, saithe, redfish, Greenland halibut and capelin in subareas 1 and 2. Taking the catch values provided by the Norwegian fisheries ministry for Norwegian catches1 and raising the total landed value to the total catches gives an approximate nominal first-hand landed value for the combined AFWG stocks of ca. 20 billion NOK or ca. 2 billion EUR (2018 estimates).
-
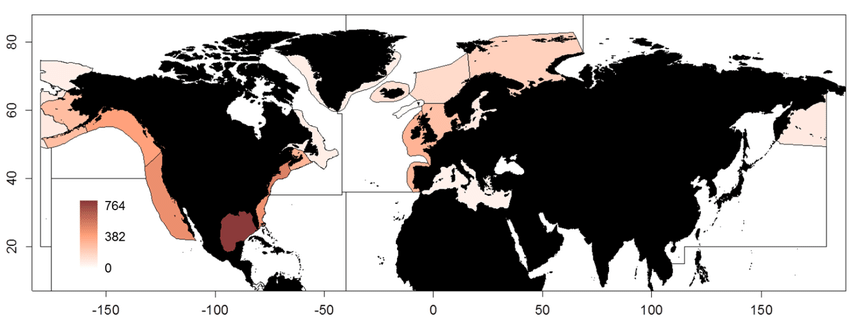
This dataset containing traits of marine fish is based on fish taxa observed during international scientific bottom-trawl surveys regularly conducted in the Northeast Atlantic, Northwest Atlantic and the Northeast Pacific. These scientific surveys target primarily demersal (bottom-dwelling) fish species, but pelagic species are also regularly recorded. The overarching aim of this dataset was to collect information on ecological traits for as many fish taxa as possible and to find area-specific trait values to account for intraspecific variation in traits, especially for widely distributed species. We collected traits for species, genera and families. The majority of trait values were sourced from FishBase (Froese and Pauly, 2019), and have been supplemented with values from the primary literature.
-
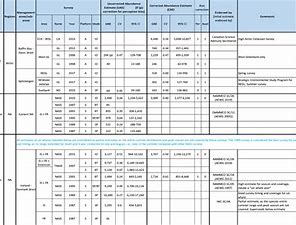
The purpose of this table is to present the best available abundance estimates for cetacean species in areas of relevance to the work of NAMMCO. It is intended to be used as a starting point for researchers, and the original sources are provided if additional information is required. The Scientific Committee of NAMMCO maintains a Working Group on Abundance Estimates, composed of invited experts in the field as well as some Committee members. This Working Group meets periodically to review new abundance estimates from recent surveys or, in some cases, re-analyses of older data. The reports of the Working Group are brought to the Scientific Committee at their annual meetings, and used to formulate advice on stock status, allowable removals or other matters. In most cases, the Scientific Committee will formally endorse estimates approved by the Working Group, and if so, this is indicated on the Table. Some estimates have been endorsed by the Scientific Committee of the International Whaling Commission (IWC).
-
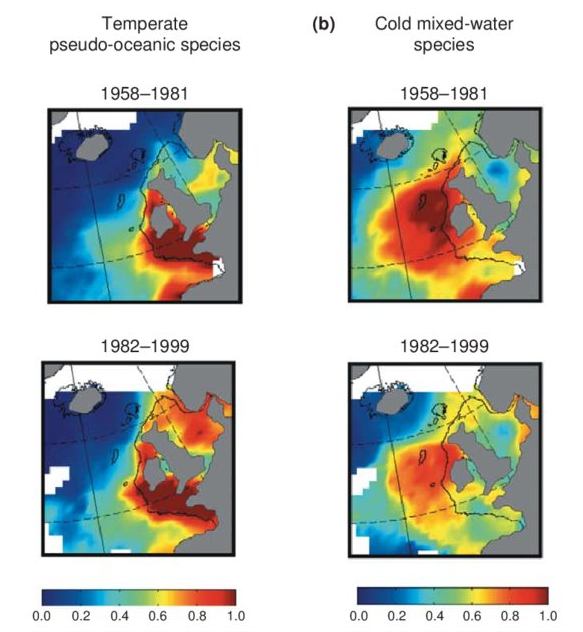
Excel file containing CPR data from Standard Areas B4,C3,C4,D3,D4,D5,E4,F4 for the plankton Calanus finmarchicus and helgolandicus, total traverse (small) copepods, total large copepods, Phytoplankton Colour Index and Cnidaria (presence denoted by a 1, absence by a zero). All taxa are from 1980, except Cnidaria which are from 2011. Dataset is in the format of sample level data, with each row being a discrete sample, with a sample being 3m3 filtered seawater, and 10nm of tow. For each row, a sample has the following information, starting at column a: Standard area of sample, sample id, latitude (decimal degrees) of sample mid point, longitude (decimal degrees) of sample midpoint, sample midpoint date and local time, year of sample, month of sample, then plankton abundance values (or PCI index or cnidaria presence/absence). All taxa have been looked for during the period this dataset spans, so zero values represent true absence.
-
.jpg)
NAMMCO is an international regional body for cooperation on conservation, management and study of cetaceans (whales, dolphins and porpoises) and pinnipeds (seals and walruses) in the North Atlantic. The members of NAMMCO — Faroe Islands, Greenland, Iceland and Norway — are committed to sustainable and responsible use of all living marine resources, including marine mammals. Through regional cooperation, the NAMMCO member countries aim to strengthen and further develop effective conservation and management measures for marine mammals. Acknowledging the rights and needs of coastal communities to make a sustainable living from what the sea can provide, such measures should be based on the best available scientific evidence and user knowledge and take into account the complexity and vulnerability of the marine ecosystem. The NAMMCO Agreement focuses on consolidating and advancing scientific knowledge of the North Atlantic marine ecosystem as a whole, and understanding better the role of marine mammals in this system. In 2017 NAMMCO member countries reaffirmed their cooperation through the Nuuk Declaration. NAMMCO Catch database: This database of reported catches is searchable and it is possible to filter the information by country, species or area. It is also possible to sort the different columns in ascending or descending order and to show up to 100 entries per page. Carry-over from previous years are included in the quota numbers, where applicable. NAMMCO aims to ensure that this database is kept up to date with correct and validated catch data. The reported catch data for harbour seals in Greenland prior to 2012 is not included in the database due to known sources of error. This includes identified errors in where harbour seal catch data has been entered in hunting reports, and cases of species misidentification.
-

The Commission for the Conservation Southern Bluefin Tuna collects a variety of data types from its Members and Cooperating Non-Members, including total catch, catch and effort data, and catch at size data. Catch, size and trade information is also collected through the Commission's Catch Documentation Scheme, Japanese import statistics, and other monitoring programs. Annual catches provided on this page are reported on a calendar year basis. CCSBT Members use quota years (not calendar years) for managing catching limits, but quota years differ between Members, so calendar years are used to provide catches on a common timescale. Relevant subsets and summaries of these data are provided below. All figures are subject to change as improved data or estimates become available. In particular, reviews of SBT data in 2006 indicated that southern bluefin tuna catches may have been substantially under-reported over the previous 10-20 years and the data presented here do not include estimates for this unreported catch. Also, data for the last reported year of catch (2020) are preliminary and are subject to revision. Any latitudes and longitudes presented in these summaries represent the north western corner of the relevant grid, which is a 5*5 grid unless otherwise specified. Other information on Members and Cooperating Non-Members fishing activities appears in the reports of the Extended Scientific Committee, Compliance Committee and Extended Commission.
-
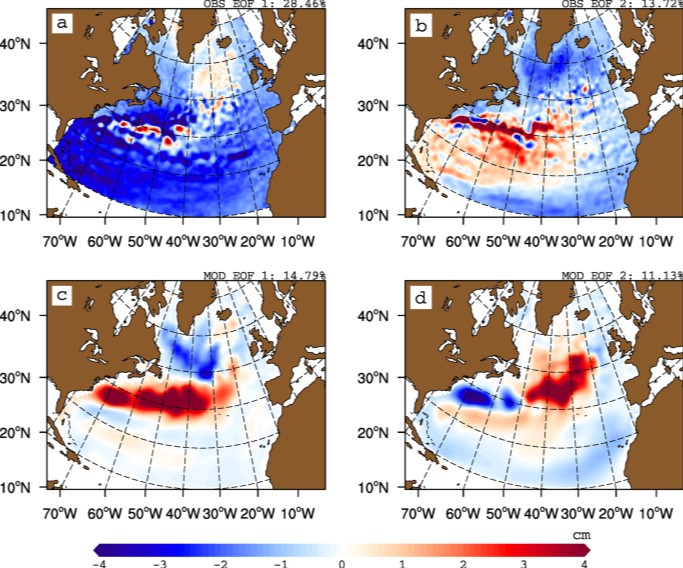
The gyre index constructed here from satellite altimetry is related to core aspects of the North Atlantic subpolar gyre, meridional overturning circulation, hydrographic properties in the Atlantic inflows toward the Arctic, and in marine ecosystems in the northeast Atlantic Ocean. The data series spans the period January 1993 to September 2018. Data description: Monthly gyre index from January 1993 until September 2018. The data is provided in one comma separated value (csv) file with the following entries on each row: year, month, index value. The index is normalized, i.e. it has a zero mean and unit standard deviation. Positive (negative) gyre index reflects stronger (weaker) than average surface circulation of the North Atlantic subpolar gyre.
-

We assembled a dataset of 14C-based productivity measurements to understand the critical variables required for accurate assessment of daily depth-integrated phytoplankton carbon fixation (PP(PPeu)u) from measurements of sea surface pigment concentrations (Csat)(Csat). From this dataset, we developed a light-dependent, depth-resolved model for carbon fixation (VGPM) that partitions environmental factors affecting primary production into those that influence the relative vertical distribution of primary production (Pz)z) and those that control the optimal assimilation efficiency of the productivity profile (P(PBopt). The VGPM accounted for 79% of the observed variability in Pz and 86% of the variability in PPeu by using measured values of PBopt. Our results indicate that the accuracy of productivity algorithms in estimating PPeu is dependent primarily upon the ability to accurately represent variability in Pbopt. We developed a temperature-dependent Pbopt model that was used in conjunction with monthly climatological images of Csat sea surface temperature, and cloud-corrected estimates of surface irradiance to calculate a global annual phytoplankton carbon fixation (PPannu) rate of 43.5 Pg C yr‒1. The geographical distribution of PPannu was distinctly different than results from previous models. Our results illustrate the importance of focusing Pbopt model development on temporal and spatial, rather than the vertical, variability.
-

All statistics of UNCTAD are harmonized and integrated into UNCTADstat- free to use dissemination platform. It gives access to basic and derived indicators built upon common rules, harmonized environment and clear methodology supported by powerful data browsing system. The statistical series are regularly updated and classified into easy-to-navigate themes. UNCTADstat offers ready-to-use analytical groupings, with a unique coverage for countries and products and a particular focus on developing and transition economies. This approach ensures data consistency across multiple data series, and enables users to harness its full potential by mixing and matching data from various domains. The navigation browser allows table or graphic presentations, easy selection and reorganization of data, personalized functionalities and several straightforward extraction options.
-
SEAPOP (SEAbird POPulations) is a long-term monitoring and mapping programme for Norwegian seabirds that was established in 2005. The programme covers seabird populations in Norway, Svalbard and adjacent sea areas, and will provide and maintain base-line knowledge of seabirds for an improved management of this marine environment. The data analyses aim to develop further models of seabird distribution and population dynamics using different environmental parameters, and to explore the degree of covariation across different sites and species. This knowledge is urgently needed to distinguish human influences from those caused by natural variation.