 Catalogue PIGMA
deep sea
Type of resources
Available actions
Topics
Keywords
Contact for the resource
Provided by
Years
Formats
Representation types
Update frequencies
Resolution
-
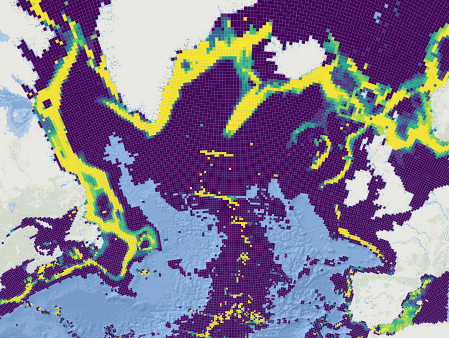
This dataset was built to feed a basin-wide spatial conservation planning exercise, targeting the deep sea of the North Atlantic, in the framework of the ATLAS H2020 project. This approach aimed to inform Marine Spatial Planning and conservation initiatives for the deep sea of the North Atlantic, by identifying conservation priority areas for the Vulnerable Marine Ecosystems (VMEs) and deep fish species and discussing the efficiency of the current spatial management context relatively to conservation stakes. This publication provides (1) the links to spatial datasets used as an input, (2) the R scripts used to run the final conservation scenarios together with associated table of targets and connectivity matrix, that can be run on the input data, and (3) the outputs of the final scenarios constructed and computed for ATLAS. Produced by IFREMER. This output reflects the authors’ views and the European Union is not responsible for any use that may be made of the information it contains. Please note that you use these data at your own risk. No warranty is expressed or implied and no liability is accepted for any inconveniences or damages that may ensue from their use.
-

This dataset was built to feed a basin-wide spatial conservation planning exercise, targeting the deep sea of the North Atlantic, in the framework of the ATLAS H2020 project. This approach aimed to inform Marine Spatial Planning and conservation initiatives for the deep sea of the North Atlantic, by identifying conservation priority areas for the Vulnerable Marine Ecosystems (VMEs) and deep fish species and discussing the efficiency of the current spatial management context relatively to conservation stakes. This publication provides (1) the links to spatial datasets used as an input, (2) the R scripts used to run the final conservation scenarios together with associated table of targets and connectivity matrix, that can be run on the input data, and (3) the outputs of the final scenarios constructed and computed for ATLAS. Produced by IFREMER.
-
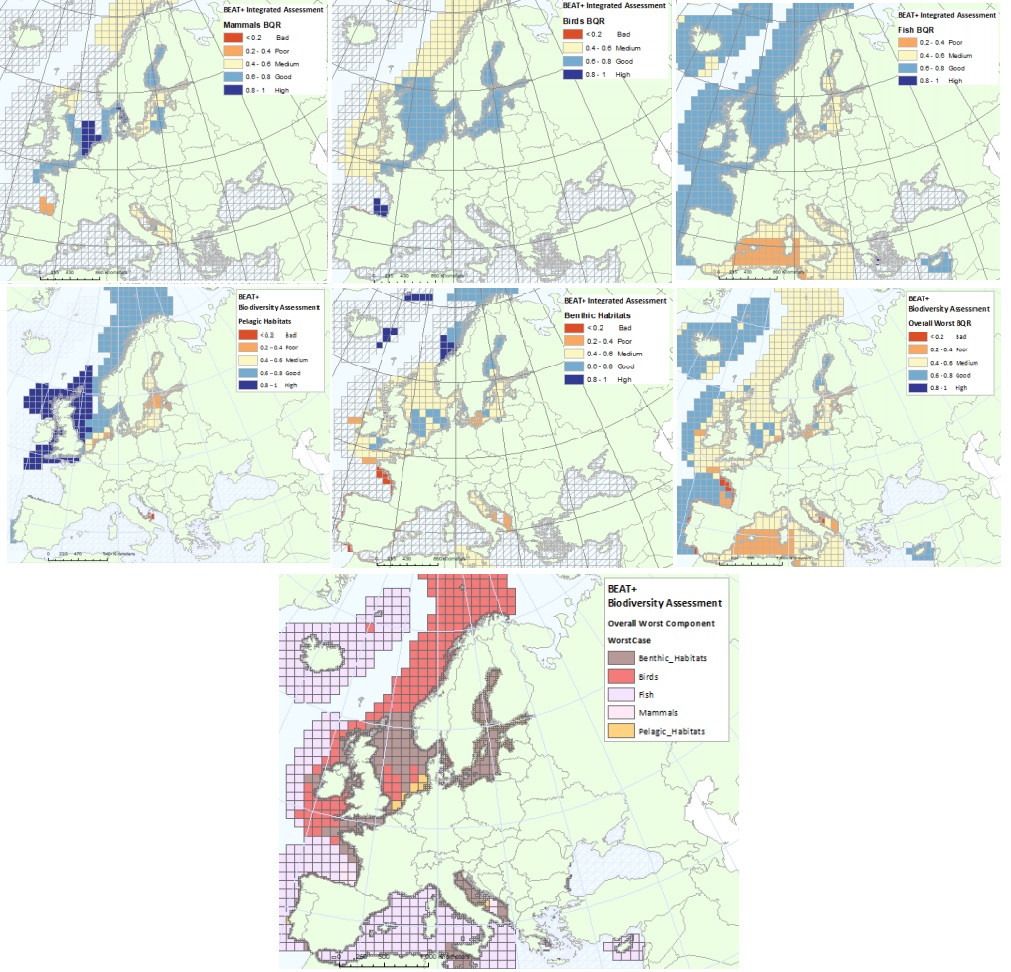
The BEAT+ tool builds on the EEA assessment tools developed and applied in the context of assessing the degree of contamination (CHASE+), eutrophication (HEAT+) and biodiversity (BEAT+) in Europe's seas. BEAT+ makes use of the same data sets and threshold values used in these assessments but recombines these in a new framework that addresses 'biodiversity condition'. BEAT+ has been designed to provide an assessment of the spatial variability of a range of biodiversity components by combining existing biodiversity indicators. The tool integrates data from normalised indicators to identify worst case status measures for different biodiversity components. The results are then linked to a standard gridE based Spatial Assessment Unit (SAU) which is used both for biodiversity and for pressures assessments (Andersen et al., 2014). These grid-based SAUs not only allow alignment of indicators for biodiversity and for pressures but provide a means for combining large assessment areas (e.g. for wide‐ranging species) with point data collected from biological surveys e.g. WFD monitoring. BEAT+ tool works by calculating a Biological Quality Ratio (BQR) which is an aggregated score of indicator outcomes within a grid square. To allow objective comparison, the indicator outcomes are normalised to a scale of 0 to 1, with five status classes at equal intervals on that scale (from Bad starting at 0, Poor at 0.2, Medium at 0.4, Good at 0.6 and High at 0.8). By this means, indicators based on different biological criteria can be aggregated in a consistent way. This metadata refers to dataset providing the results of classification of biodiversity status using the BEAT+ tool. The status is evaluated in five classes, where High and Good are recognised as ‘non-problem areas’ and Moderate, Poor and Bad are recognised as ‘problem areas’. The dataset covers: - BQR Assessment of all marine mammals combined (mainly focused on coastal and relatively stable inshore populations of seals, dolphins and porpoises) - BQR Assessment of seabirds and wading birds - BQR Assessment of commercial fish (as these have agreed targets defined on biomass and fishing mortality) - BQR Assessment of pelagic habitats - BQR Assessment of benthic habitats - BQR Assessment of worst-performing biodiversity groups - An overall synthesis of the Biological Quality Ratios (BQR) values (showing which are the worst -lowest- BQR values in each assessment grid cell. The ‘worst’ value is used here to identify the biological group most at risk, rather than averaging over all groups to avoid over-emphasis on groups with more intensive monitoring). As reference, please consult the ETC/ICM Report 3/2019: Biodiversity in Europe's seas: https://www.eionet.europa.eu/etcs/etc-icm/products/biodiversity-in-europes-seas. The indicator BEAT+ Integrated Assessment Worst Case BQR has been used in the EEA report 17/2019 "Marine Messages II": https://www.eea.europa.eu/publications/marine-messages-2.