CERSAT Exploitation
Type of resources
Available actions
Topics
Keywords
Contact for the resource
Provided by
Years
Formats
Representation types
status
Resolution
-

This product provides a “Final” (Refined) Level-2 Sea Surface Temperature (SST) (currently identified by "v8.2" within the file name) for the Group for High Resolution Sea Surface Temperature (GHRSST) Project, which is derived from the Advanced Microwave Scanning Radiometer 2 (AMSR2) by Remote Sensing Systems (RSS, or REMSS). AMSR2 was launched on 18 May 2012, onboard the Global Change Observation Mission - Water (GCOM-W) satellite developed by the Japan Aerospace Exploration Agency (JAXA). The GCOM-W mission aims to establish the global and long-term observation system to collect data, which is needed to understand mechanisms of climate and water cycle variations, and demonstrate its utilization. AMSR2 onboard the first generation of the GCOM-W satellite will continue Aqua/AMSR-E observations of water vapor, cloud liquid water, precipitation, SST, sea surface wind speed, sea ice concentration, snow depth, and soil moisture. AMSR2 is a remote sensing instrument for measuring weak microwave emission from the surface and the atmosphere of the Earth. The antenna of AMSR2 rotates once per 1.5 seconds and obtains data over a 1450 km swath. This conical scan mechanism enables AMSR2 to acquire a set of daytime and nighttime data with more than 99% coverage of the Earth every 2 days. The “Final” SSTs are processed when RSS receives the atmospheric model National Center for Environmental Prediction (NCEP) Final Analysis (FNL) Operational Global Analysis. The NCEP wind directions are particularly useful for retrieving more accurate SSTs and wind speeds.
-
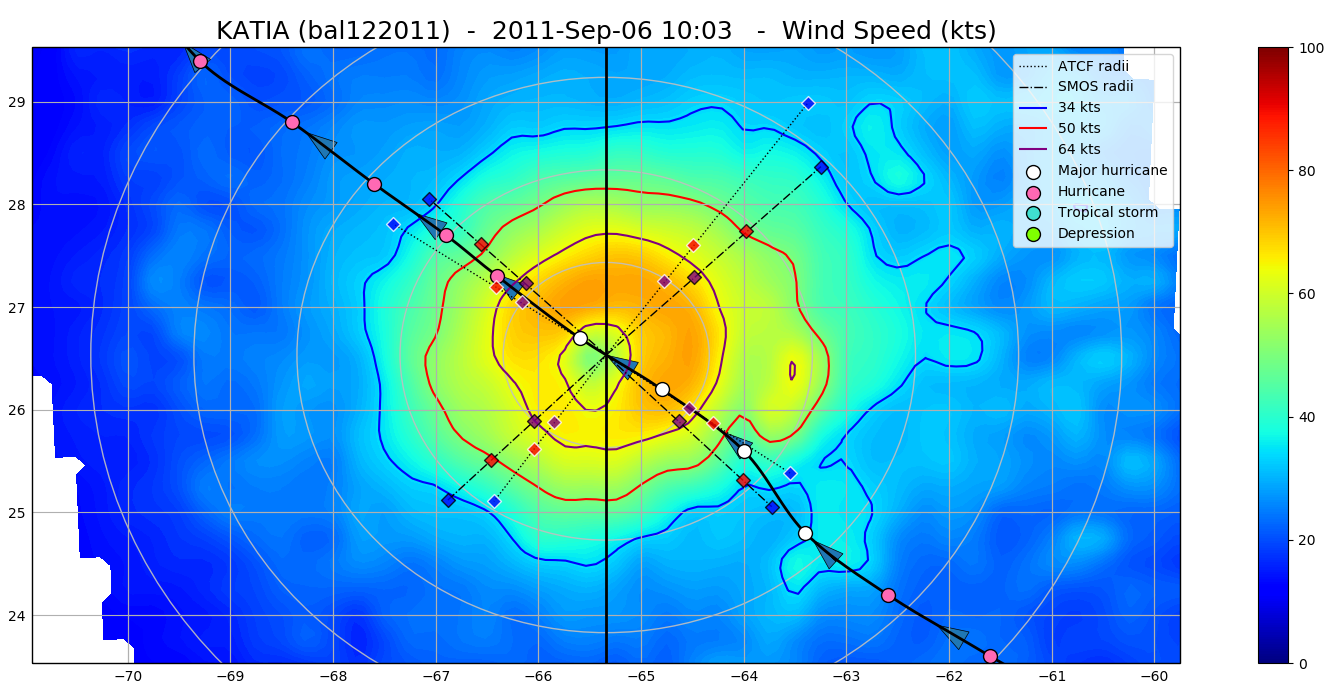
The SMOS WRF product is available in Near Real Time to support tropical cyclones (TC) forecasts. It is generated within 4 to 6 hours from sensing from the SMOS L2 swath wind speed products (SMOS L2WS NRT), in the so-called "Fix (F-deck)" format compatible with the US Navy's ATCF (Automated Tropical Cyclone Forecasting) System. The SMOS WRF "fixes" to the best-track forecasts contain : the SMOS 10-min maximum-sustained winds (in knots) and wind radii (in nautical miles) for the 34 kt (17 m/s), 50 kt (25 m/s) and 64 kt (33 m/s) winds per geographical storm quadrants, and for each SMOS pass intercepting a TC in all the active ocean basins. See the complete description the "SMOS Wind Data Service Product Description Document" ( http://www.smosstorm.org/Document-tools/SMOS-Wind-Data-Service-Documentation ).
-
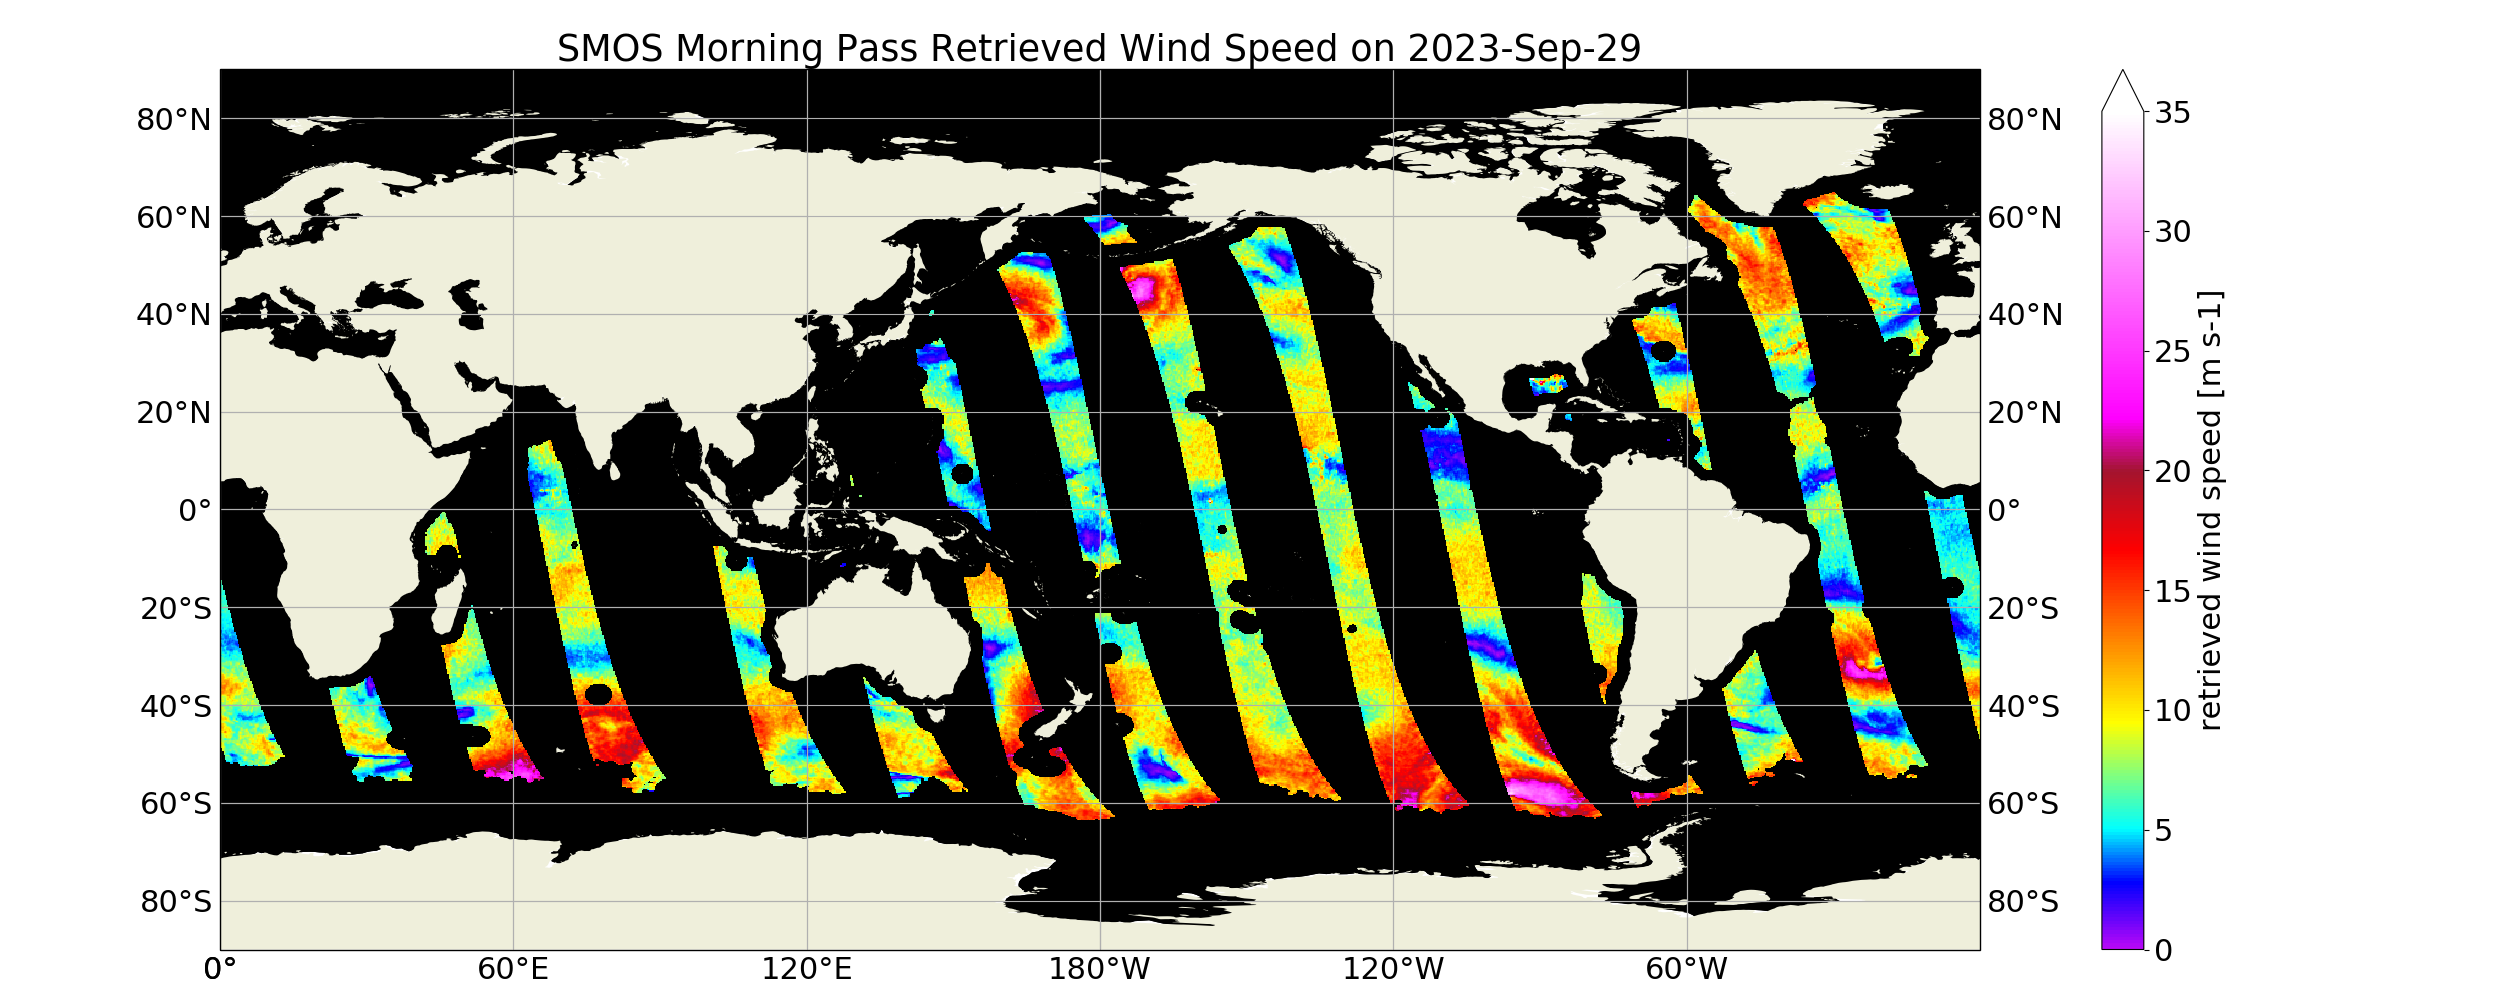
“SMOS Level 3 daily wind speed” (SMOS L3WS) products are daily composite maps of the collected SMOS L2 swath wind products for a specific day, provided with the same grid than the Level 2 wind data (SMOS L2WS NRT) but separated into ascending and descending passes. SMOS L3WS products are available the day after from sensing and are generated in NetCDF-4 format as described in the "SMOS Wind Data Service Product Description Document" (http://www.smosstorm.org/Document-tools/SMOS-Wind-Data-Service-Documentation ).
-
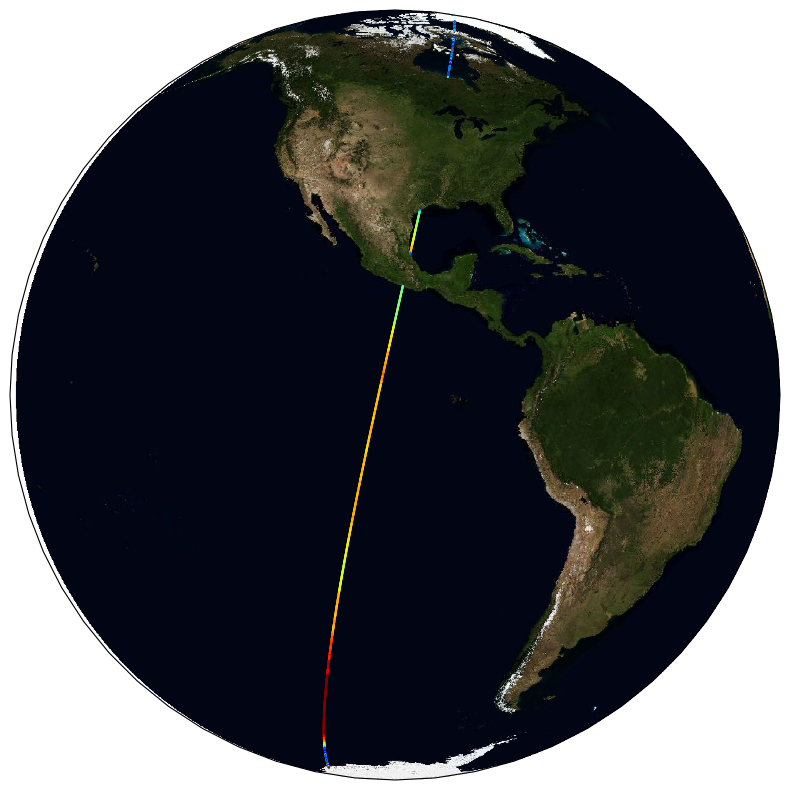
The ESA Sea State Climate Change Initiative (CCI) project has produced global multi-sensor time-series of along-track satellite altimeter significant wave height data (referred to as Level 2P (L2P) data) with a particular focus for use in climate studies. This dataset contains the Version 3 Remote Sensing Significant Wave Height product, which provides along-track data at approximately 6 km spatial resolution, separated per satellite and pass, including all measurements with flags, corrections and extra parameters from other sources. These are expert products with rich content and no data loss. The altimeter data used in the Sea State CCI dataset v3 come from multiple satellite missions spanning from 2002 to 2022021 (Envisat, CryoSat-2, Jason-1, Jason-2, Jason-3, SARAL, Sentinel-3A), therefore spanning over a shorter time range than version 1.1. Unlike version 1.1, this version 3 involved a complete and consistent retracking of all the included altimeters. Many altimeters are bi-frequency (Ku-C or Ku-S) and only measurements in Ku band were used, for consistency reasons, being available on each altimeter but SARAL (Ka band).
-
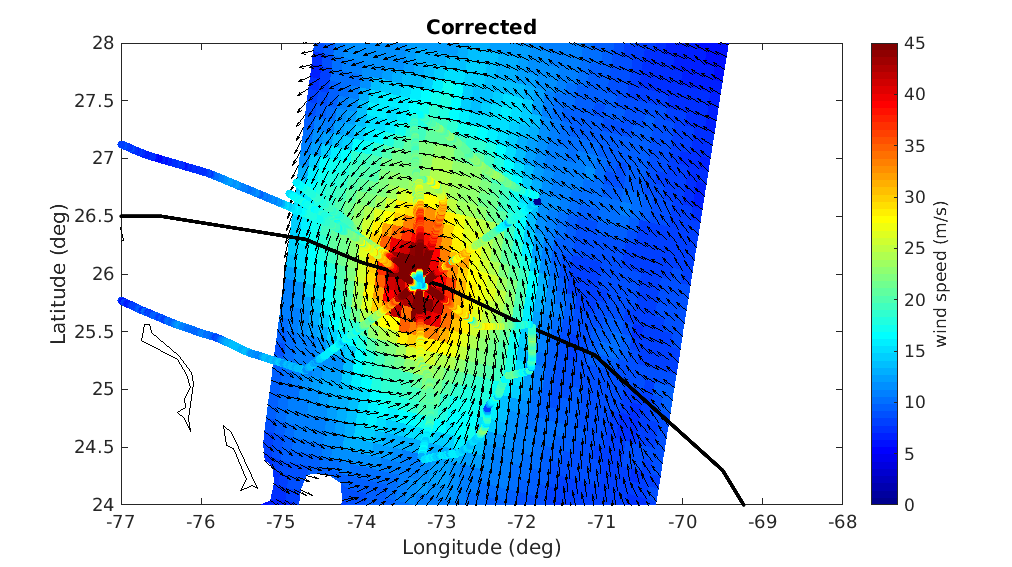
A prerequisite for a successful development of a multi-mission wind dataset is to ensure good inter-calibration of the different extreme wind datasets to be integrated in the product. Since the operational hurricane community is working with the in-situ dropsondes as wind speed reference, which are in turn used to calibrate the NOAA Hurricane Hunter Stepped Frequency Microwave Radiometer (SFMR) wind data, MAXSS has used the latter to ensure extreme-wind inter-calibration among the following scatterometer and radiometer systems: the Advanced Scatterometers onboard the Metop series (i.e., ASCAT-A, -B, and -C), the scatterometers onboard Oceansat-2 (OSCAT) and ScatSat-1 (OSCAT-2), and onboard the HY-2 series (HSCAT-A, -B); the Advanced Microwave Scanning Radiometer 2 onboard GCOM-W1(AMSR-2), the multi-frequency polarimetric radiometer (Windsat), and the L-band radiometers onboard the Soil Moisture and Ocean Salinity (SMOS) and the Soil Moisture Active Passive (SMAP) missions. In summary, a two-step strategy has been followed to adjust the high and extreme wind speeds derived from the mentioned scatterometer and radiometer systems, available in the period 2009-2020. First, the C-band ASCATs have been adjusted against collocated storm-motion centric SFMR wind data. Then, both SFMR winds and ASCAT adjusted winds have been used to adjust all the other satellite wind systems. In doing so, a good inter-calibration between all the systems is ensured not only under tropical cyclone (TC) conditions, but also elsewhere. This dataset was produced in the frame of the ESA funded Marine Atmosphere eXtreme Satellite Synergy (MAXSS) project. The primary objective of the ESA Marine Atmosphere eXtreme Satellite Synergy (MAXSS) project is to provide guidance and innovative methodologies to maximize the synergetic use of available Earth Observation data (satellite, in situ) to improve understanding about the multi-scale dynamical characteristics of extreme air-sea interaction.
-
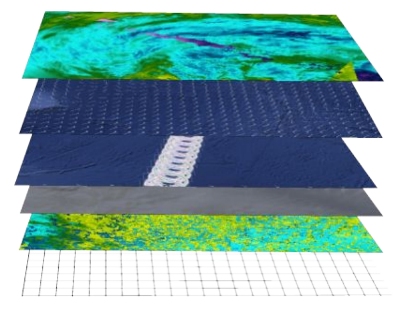
The SWISCA Level 2S (L2S) product provides along-track colocation of SWIM wave measuring instrument onto SCAT scatterometer grid, over the global ocean. SWIM and SCAT are both instruments onboard CFOSAT. CFOSAT (Chinese French Ocean SATellite) is a french-chinese mission launched in 2018, whose aim is to provide wind (SCAT instrument) and wave (SWIM instrument) measurements over the sea surface. The SWISCA L2S product is broken down into three different subproducts: - L2A containing the sigma0 of both SWIM and SCAT - L2B containing the wave parameters measured by SWIM and wind vectors measured by SCAT - AUX containing additional ancillary fields such as sea ice concentration (from CERSAT/SSMI), ocean currents (from CMEMS/GlobCurrent), SST and Wind (from ECMWF), rain rate (from IMERG), and WaveWatch3 wave spectra. All SWIM and ancillary observations are resampled onto SCAT scatterometer's geometry (wind vector cells, WVC). The SWISCA level 2S product is generated in delayed mode, a few days after acquisition. It is intended to foster cross analysis of SWIM and SCAT observations, and their combination to improve the retrieval of both wind and wave parameters. The SWISCA L2S product is generated and distributed by Ifremer / CERSAT in the frame of the Ifremer Wind and Wave Operation Center (IWWOC) co-funded by Ifremer and CNES and dedicated to the processing of the delayed mode data of CFOSAT mission.
-
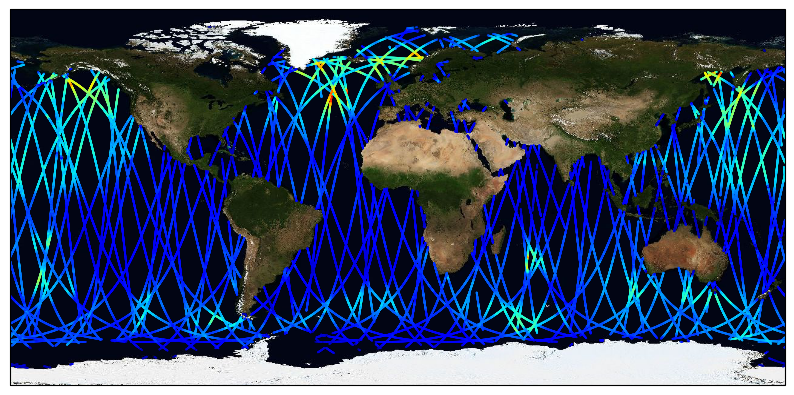
The ESA Sea State Climate Change Initiative (CCI) project has produced global daily merged multi-sensor time-series of along-track satellite altimeter significant wave height data (referred to as Level 3 (L3) data) with a particular focus for use in climate studies. This dataset contains the Version 3 Remote Sensing Significant Wave Height product, which provides along-track data at approximately 6 km spatial resolution. It has been generated from upstream Sea State CCI L2P products, edited and merged into daily products, retaining only valid and good quality measurements from all altimeters over one day, with simplified content (only a few key parameters). This is close to what is delivered in Near-Real Time by the CMEMS (Copernicus - Marine Environment Monitoring Service) project. It covers the date range from 2002-2021. The altimeter data used in the Sea State CCI dataset v3 come from multiple satellite missions (Envisat, CryoSat-2, Jason-1, Jason-2, Jason-3, SARAL, Sentinel-3A), therefore spanning over a shorter time range than version 1.1. Unlike version 1.1, this version 3 involved a complete and consistent retracking of all the included altimeters. Many altimeters are bi-frequency (Ku-C or Ku-S) and only measurements in Ku band were used, for consistency reasons, being available on each altimeter but SARAL (Ka band).
-
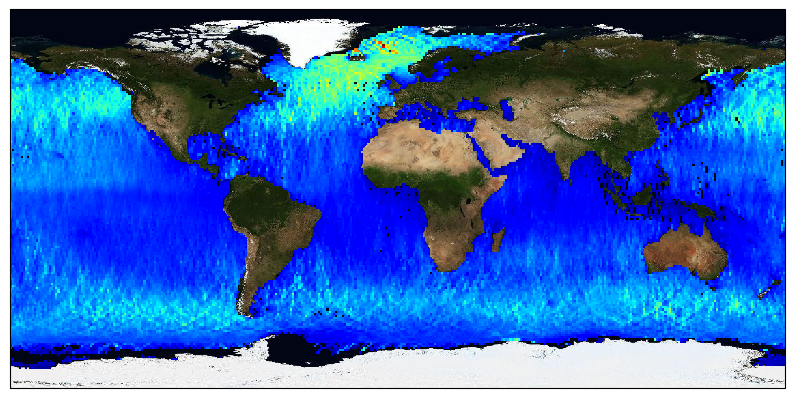
The ESA Sea State Climate Change Initiative (CCI) project has produced global multi-sensor time-series of along-track satellite altimeter significant wave height data (referred to as Level 4 (L4) data) with a particular focus for use in climate studies. This dataset contains the Version 3 Remote Sensing Significant Wave Height product, gridded over a global regular cylindrical projection (1°x1° resolution), averaging valid and good measurements from all available altimeters on a monthly basis (using the L2P products also available). These L4 products are meant for statistics and visualization. The altimeter data used in the Sea State CCI dataset v3 come from multiple satellite missions spanning from 2002 to 2021 ( Envisat, CryoSat-2, Jason-1, Jason-2, Jason-3, SARAL, Sentinel-3A), therefore spanning over a shorter time range than version 1.1. Unlike version 1.1, this version 3 involved a complete and consistent retracking of all the included altimeters. Many altimeters are bi-frequency (Ku-C or Ku-S) and only measurements in Ku band were used, for consistency reasons, being available on each altimeter but SARAL (Ka band).
-
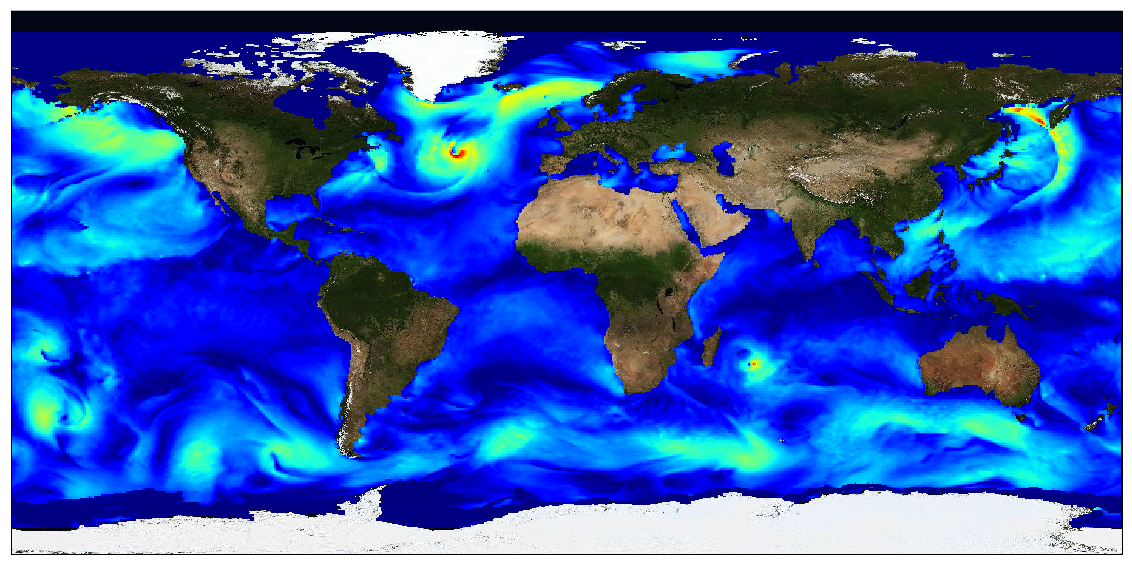
This dataset provides surface Stokes drift as retrieved from the wave energy spectrum computed by the spectral wave model WAVEWATCH-III (r), under NOAA license, discretized in wave numbers and directions and the water depth at each location. It is estimated at the sea surface and expressed in m.s-1. WAVEWATCH-III (r) model solves the random phase spectral action density balance equation for wavenumber-direction spectra. Please refer to the WAVEWATCH-III User Manual for fully detailed description of the wave model equations and numerical approaches. The data are available through HTTP and FTP; access to the data is free and open. In order to be informed about changes and to help us keep track of data usage, we encourage users to register at: https://forms.ifremer.fr/lops-siam/access-to-esa-world-ocean-circulation-project-data/ This dataset was generated by Ifremer / LOPS and is distributed by Ifremer / CERSAT in the frame of the World Ocean Circulation (WOC) project funded by the European Space Agency (ESA).
-
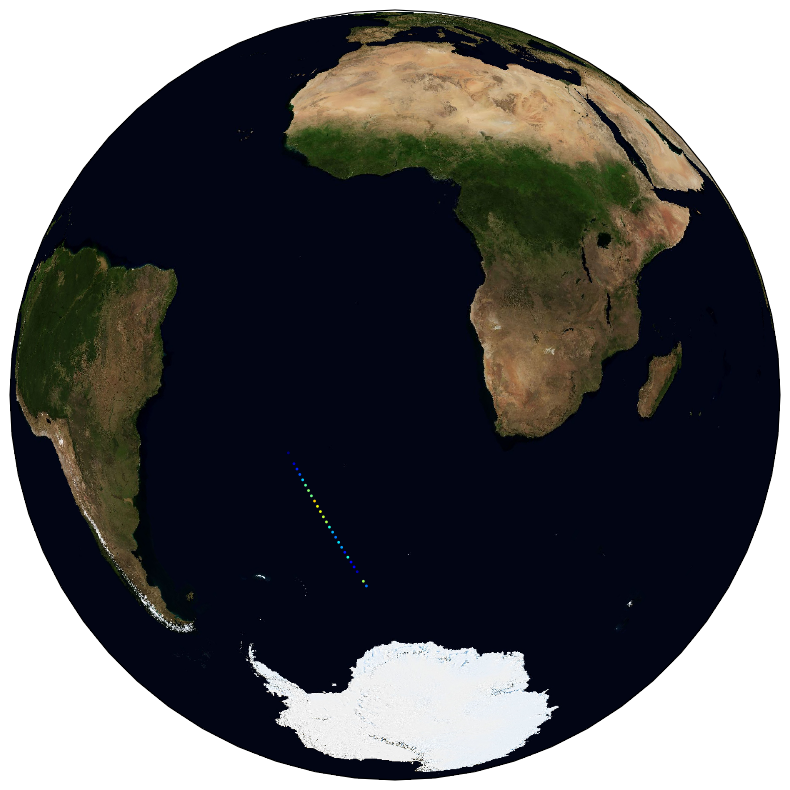
The ESA Sea State Climate Change Initiative (CCI) project has produced global multi-sensor time-series of along-track satellite synthetic aperture radar (SAR) integrated sea state parameters (ISSP) data from ENVISAT (referred to as SAR Wave Mode onboard ENVISAT Level 2P (L2P) ISSP data) with a particular focus for use in climate studies. This dataset contains the ENVISAT Remote Sensing Integrated Sea State Parameter product (version 1.1), which forms part of the ESA Sea State CCI version 3.0 release. This product provides along-track significant wave height (SWH) measurements at 5km resolution every 100km, processed using the Li et al., 2020 empirical model, separated per satellite and pass, including all measurements with flags and uncertainty estimates. These are expert products with rich content and no data loss. The SAR Wave Mode data used in the Sea State CCI SAR WV onboard ENVISAT Level 2P (L2P) ISSP v3 dataset come from the ENVISAT satellite mission spanning from 2002 to 2012.
 Catalogue PIGMA