 Catalogue PIGMA
dataset
Type of resources
Available actions
Topics
Keywords
Contact for the resource
Provided by
Years
Formats
Representation types
Update frequencies
status
Scale
Resolution
-
Monthly time series of Total Nitrogen [mg/l] from model data
-
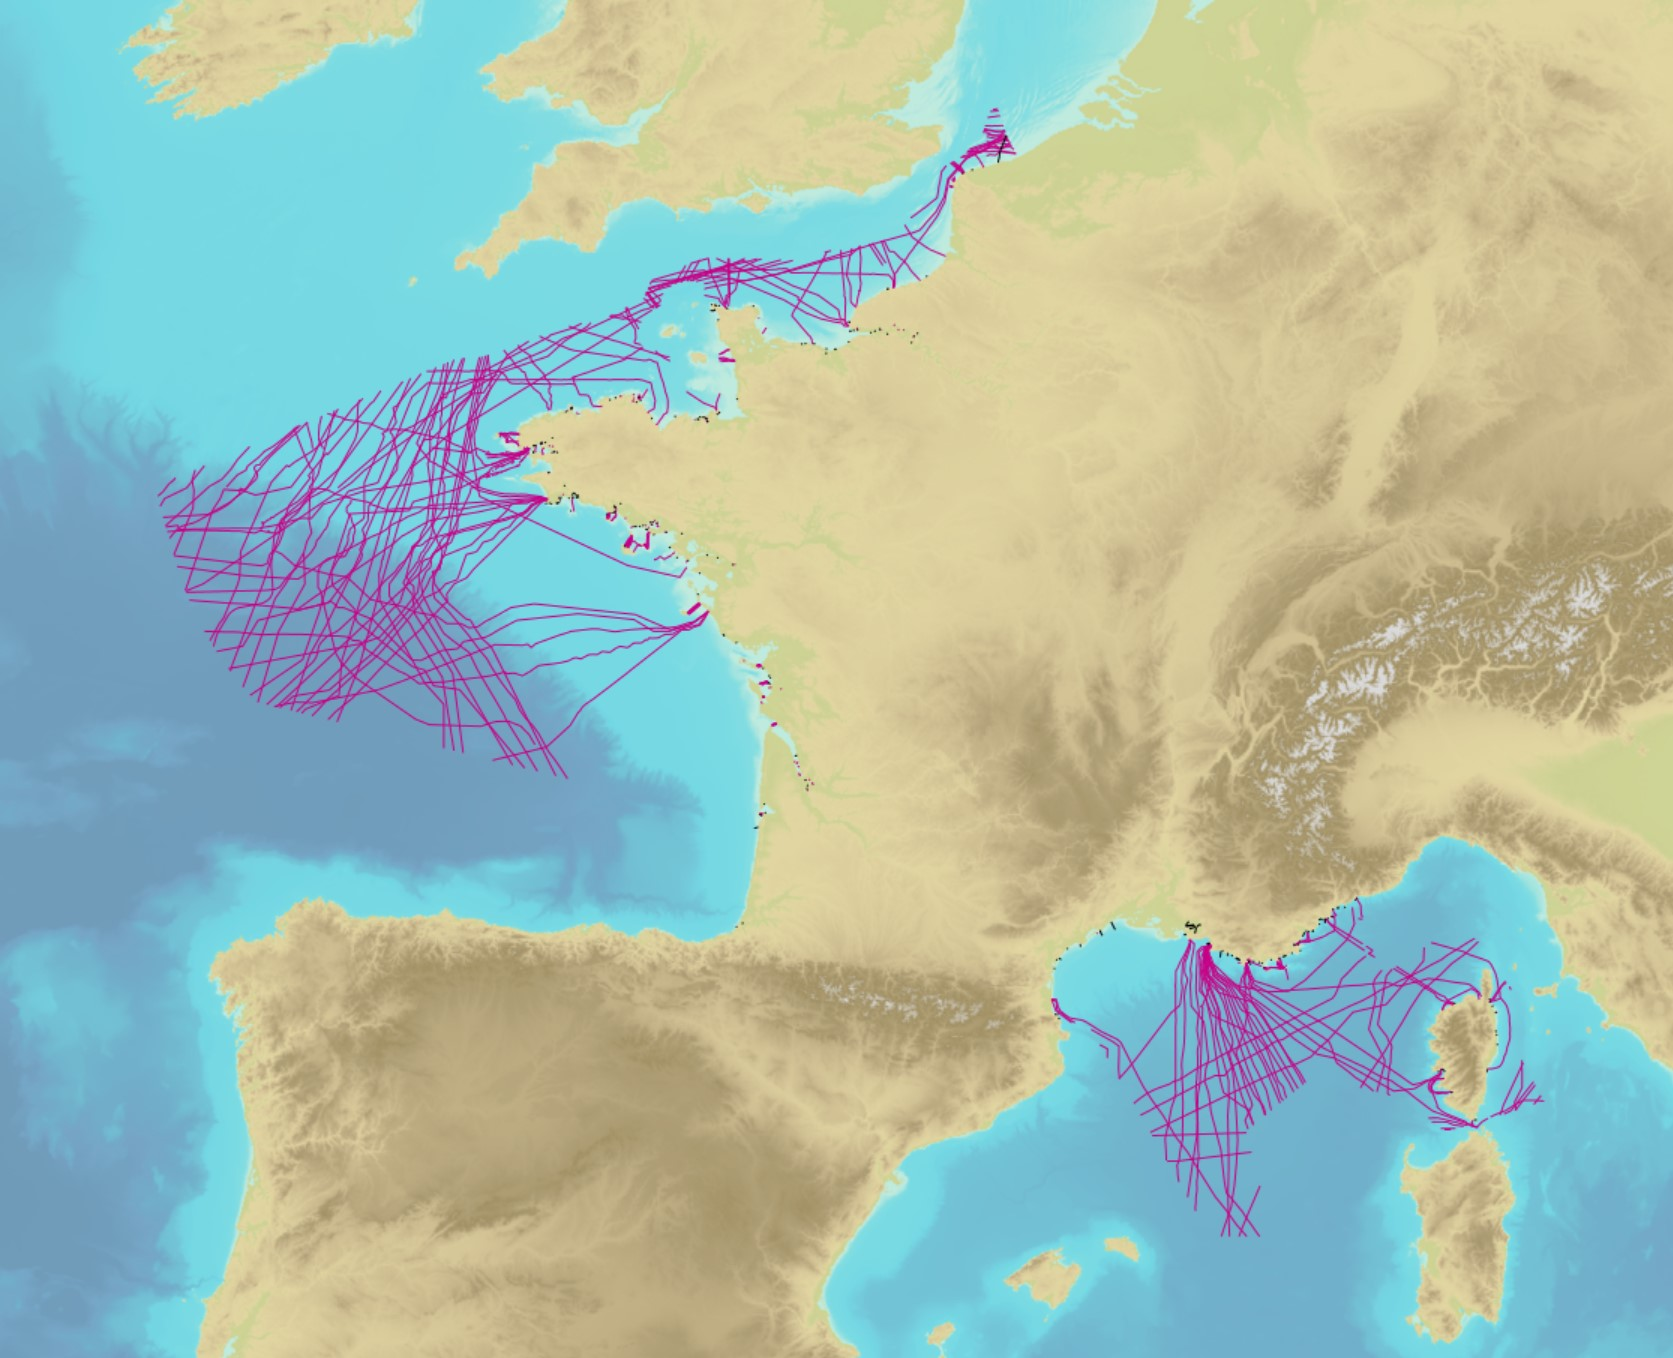
The product contains a description of submarine cables and pipelines brought to the attention of Shom on French areas of responsibility. These are 2D linear objects of the seabed that divide into two categories: • The submarine cables: these are cables placed on the seabed where electricity or information (telecommunication) flows. They represent the vast majority of objects (more than 90%); • Emissaries and submarine pipes: these are pipes that allow the discharge, sampling or circulation of fluids.
-

This product contains daily salinity fields over Arctic from a 9 days temporal gaussian average, corrected from land-sea contamination and latitudinal bias, based on L2Q over Arctic products, mixing ascending and descending orbits.
-
-
Auteur(s): Sanderre Alain, Desmoulins Christian , Projet thérapeutique étudié en fonction de l'architecture
-
Auteur(s): Darracq Alain, Desmoulins Christian , Proposition pour la reconversion d'une ancienne minoterie en en lieu de création artistique et artisanale
-
Auteur(s): Dorgambide Jacques, Desmoulins Christian , Pouvoir apporter à tous ceux qui vont vers le sport un lieu d'accueil favorisant : l'initiation donc la connaissance des gestes sportifs, la prévention donc la connaissance de ses moyens et le risque encouru par la pratique du sport, l'animation donc ouvrir vers une très large participation, l'information donc la relation de sportif néophyte (enfants, adultes, parents)
-
Auteur(s): Jutan Emmanuelle , Ce TPFE est d'abord un constat d'échec : celui de l'urbanisme de dalle appliqué au quartier de Mériadeck à Bordeaux. Revenant sur la genèse de ce type d'aménagement urbain caractéristique des Trente Glorieuses, l'auteur se livre, ensuite, à une analyse critique du lieu. Son diagnostic sévère mais argumenté l'incite à s'interroger sur les modalités d'une réhabilitation et d'une requalification du site.
-
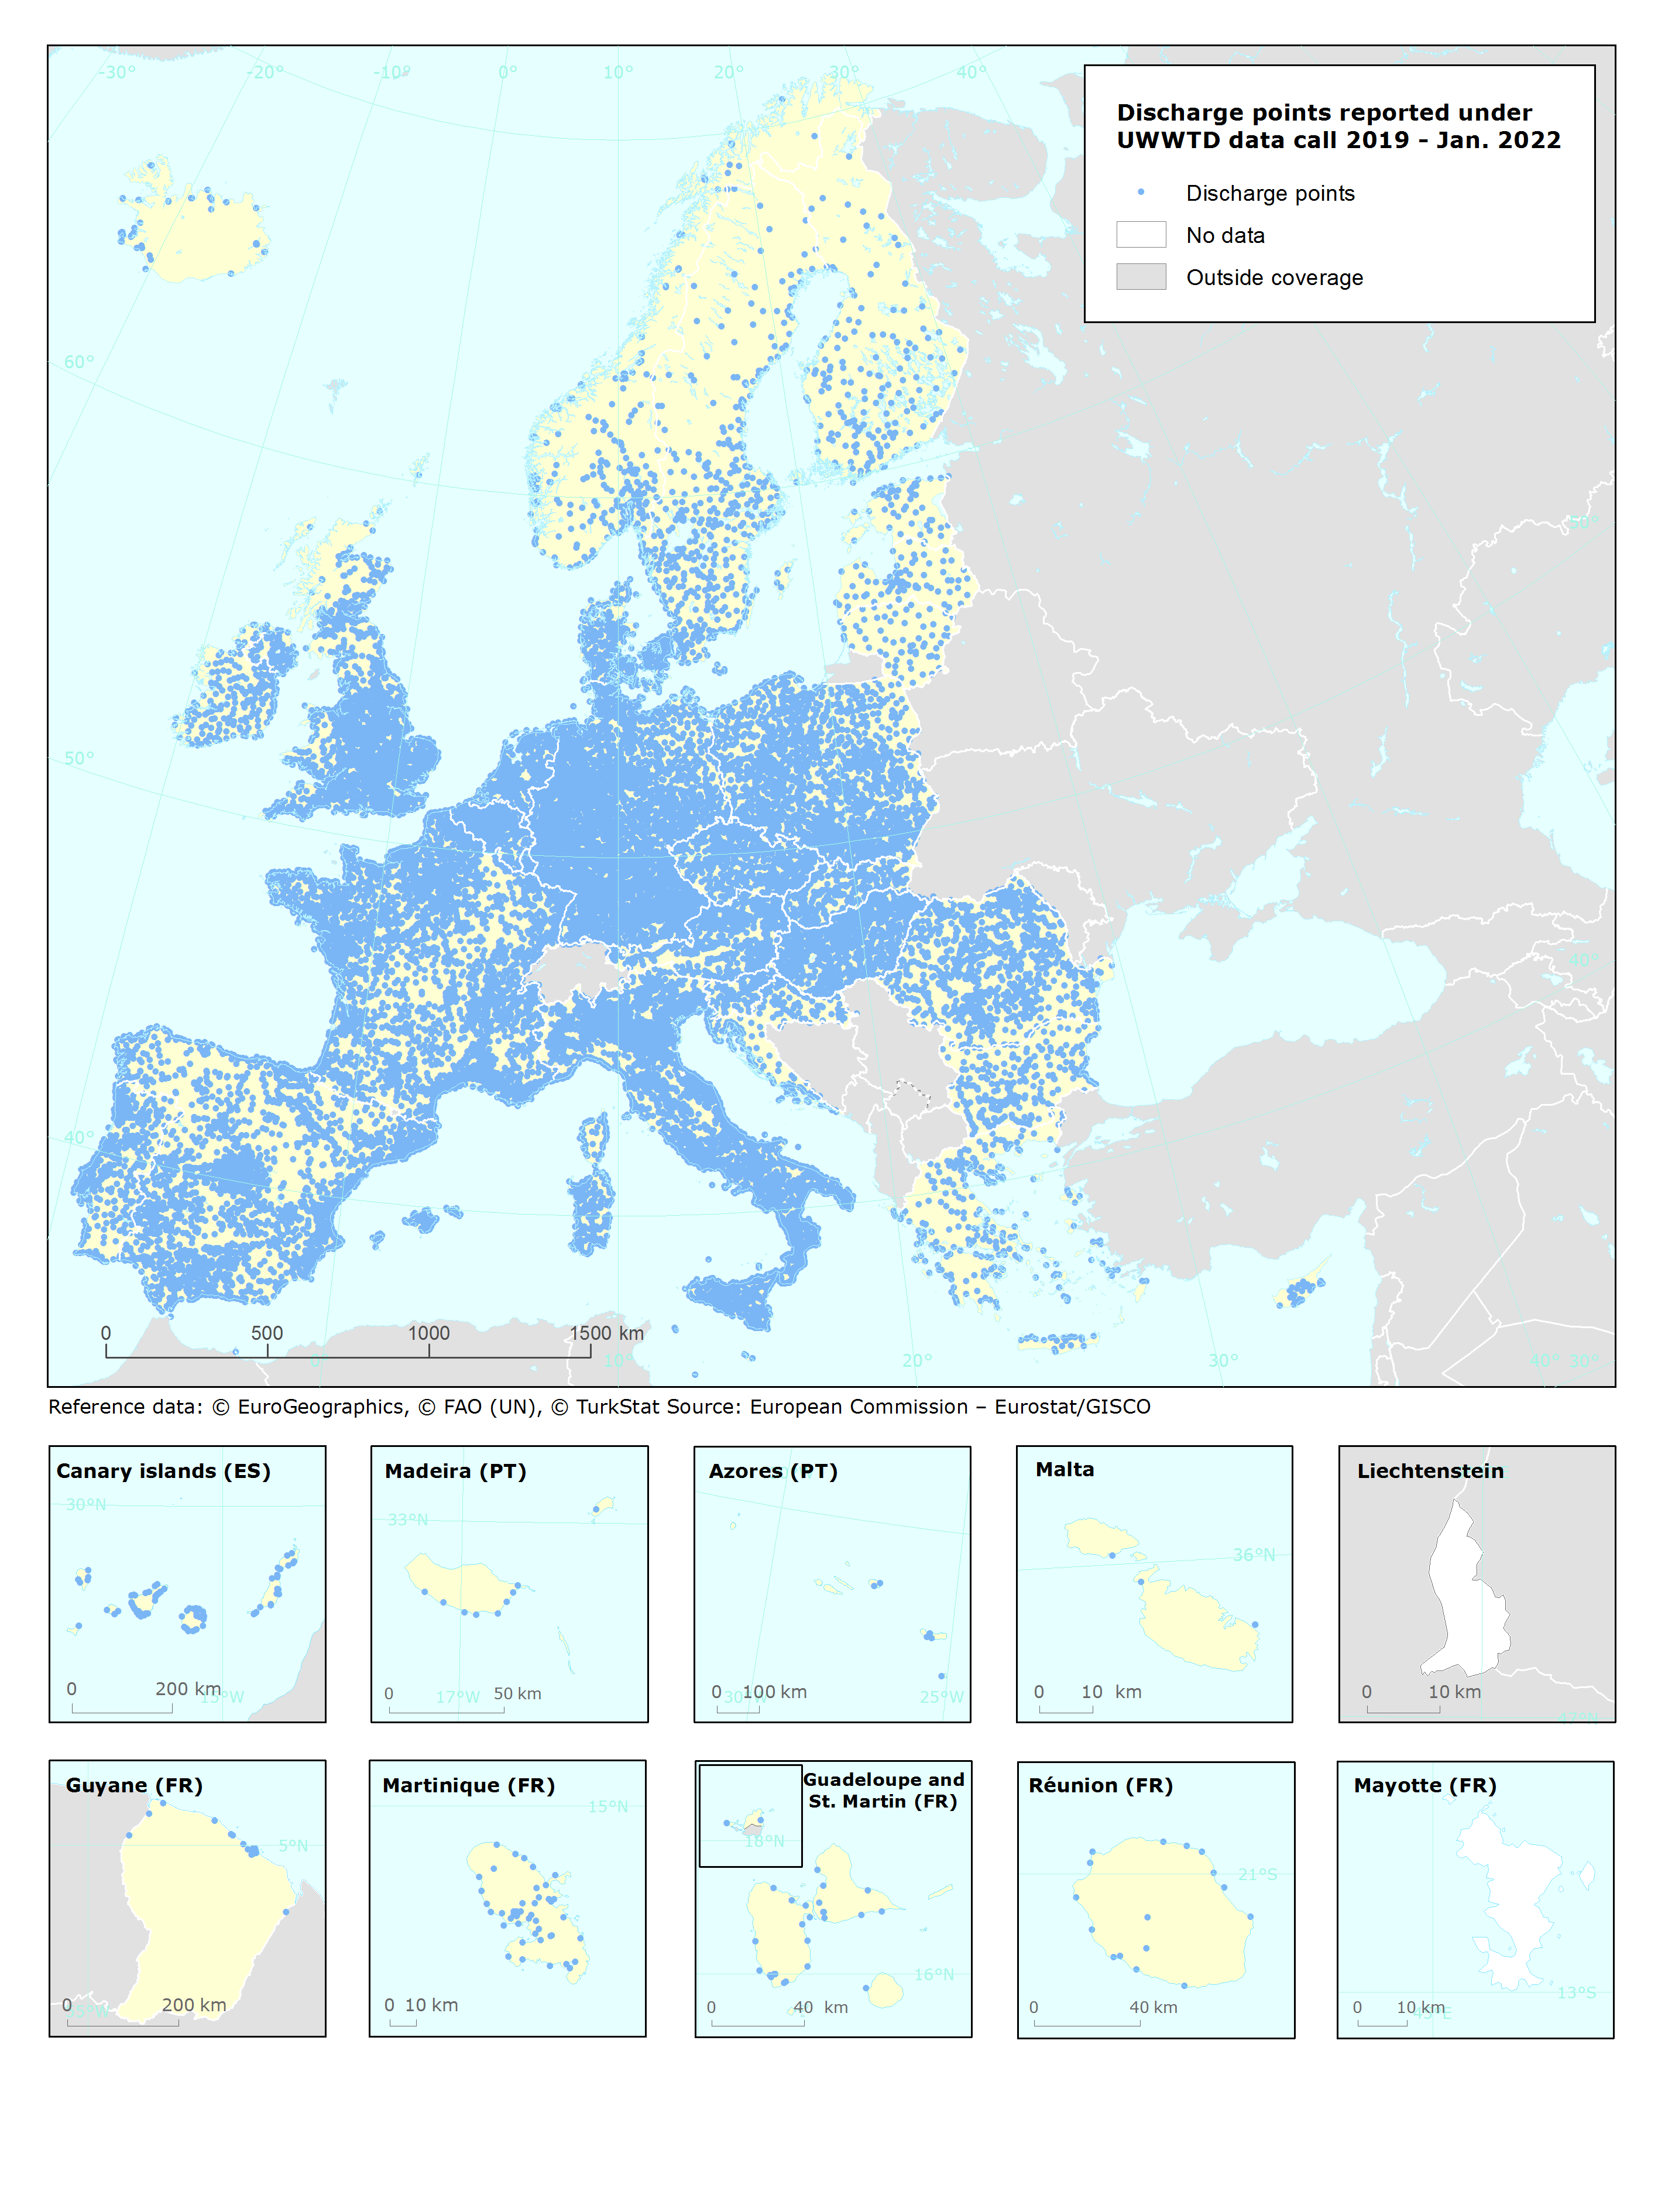
UWWTD Discharge Points, Jan. 2022 is one of the datasets produced within the frame of the reporting under 11th UWWTD Art.15 reporting period (UWWTD data call 2019). The Urban Waste Water Treatment Directive (UWWTD) (91/271/EEC) obliges Member States to report data on the implementation of the Directive upon request from the European Commission bi-annually. Reported data include receiving areas as designated under UWWTD, agglomerations, urban waste water treatment plants serving the agglomerations and points of discharges. Dataset UWWTD_DischargePoints contains information on individual points of discharge from urban waste water treatment plants or collecting systems, including their coordinates of discharge, link to specific treatment plant, type of receiving area into which the effluent / wastewater is discharged, related waterbody (or river basin), information on the discharge on land and potential reuse of the treated waste water. This dataset includes the reported discharge points which are displayed on the UWWTD maps (https://www.eea.europa.eu/themes/water/european-waters/water-use-and-environmental-pressures/uwwtd/interactive-maps/urban-waste-water-treatment-maps-3). The active discharge points with correct coordinates in the reported data were selected from the source European UWWTD tabular dataset, which is available on the download link https://www.eea.europa.eu/data-and-maps/data/waterbase-uwwtd-urban-waste-water-treatment-directive-7. The definition of the UWWTD Discharge Points dataset attributes (fields) is available on the link https://dd.eionet.europa.eu/datasets/latest/UWWTDArt15/tables/DischargePoints The full (internal) dataset including inactive discharge points is available under "Urban Waste Water Treatment Directive, Discharge points reported under UWWTD data call 2019 - INTERNAL VERSION, Jan. 2022". In comparison to the previous version (Nov. 2020), late redeliveries and corrections provided by several countries during 2021 are included in current revision. Next, the dataset is provided in GeoPackage and ESRI File geodatabase formats instead of shapefile used up to now, to avoid truncation of attribute names.
-
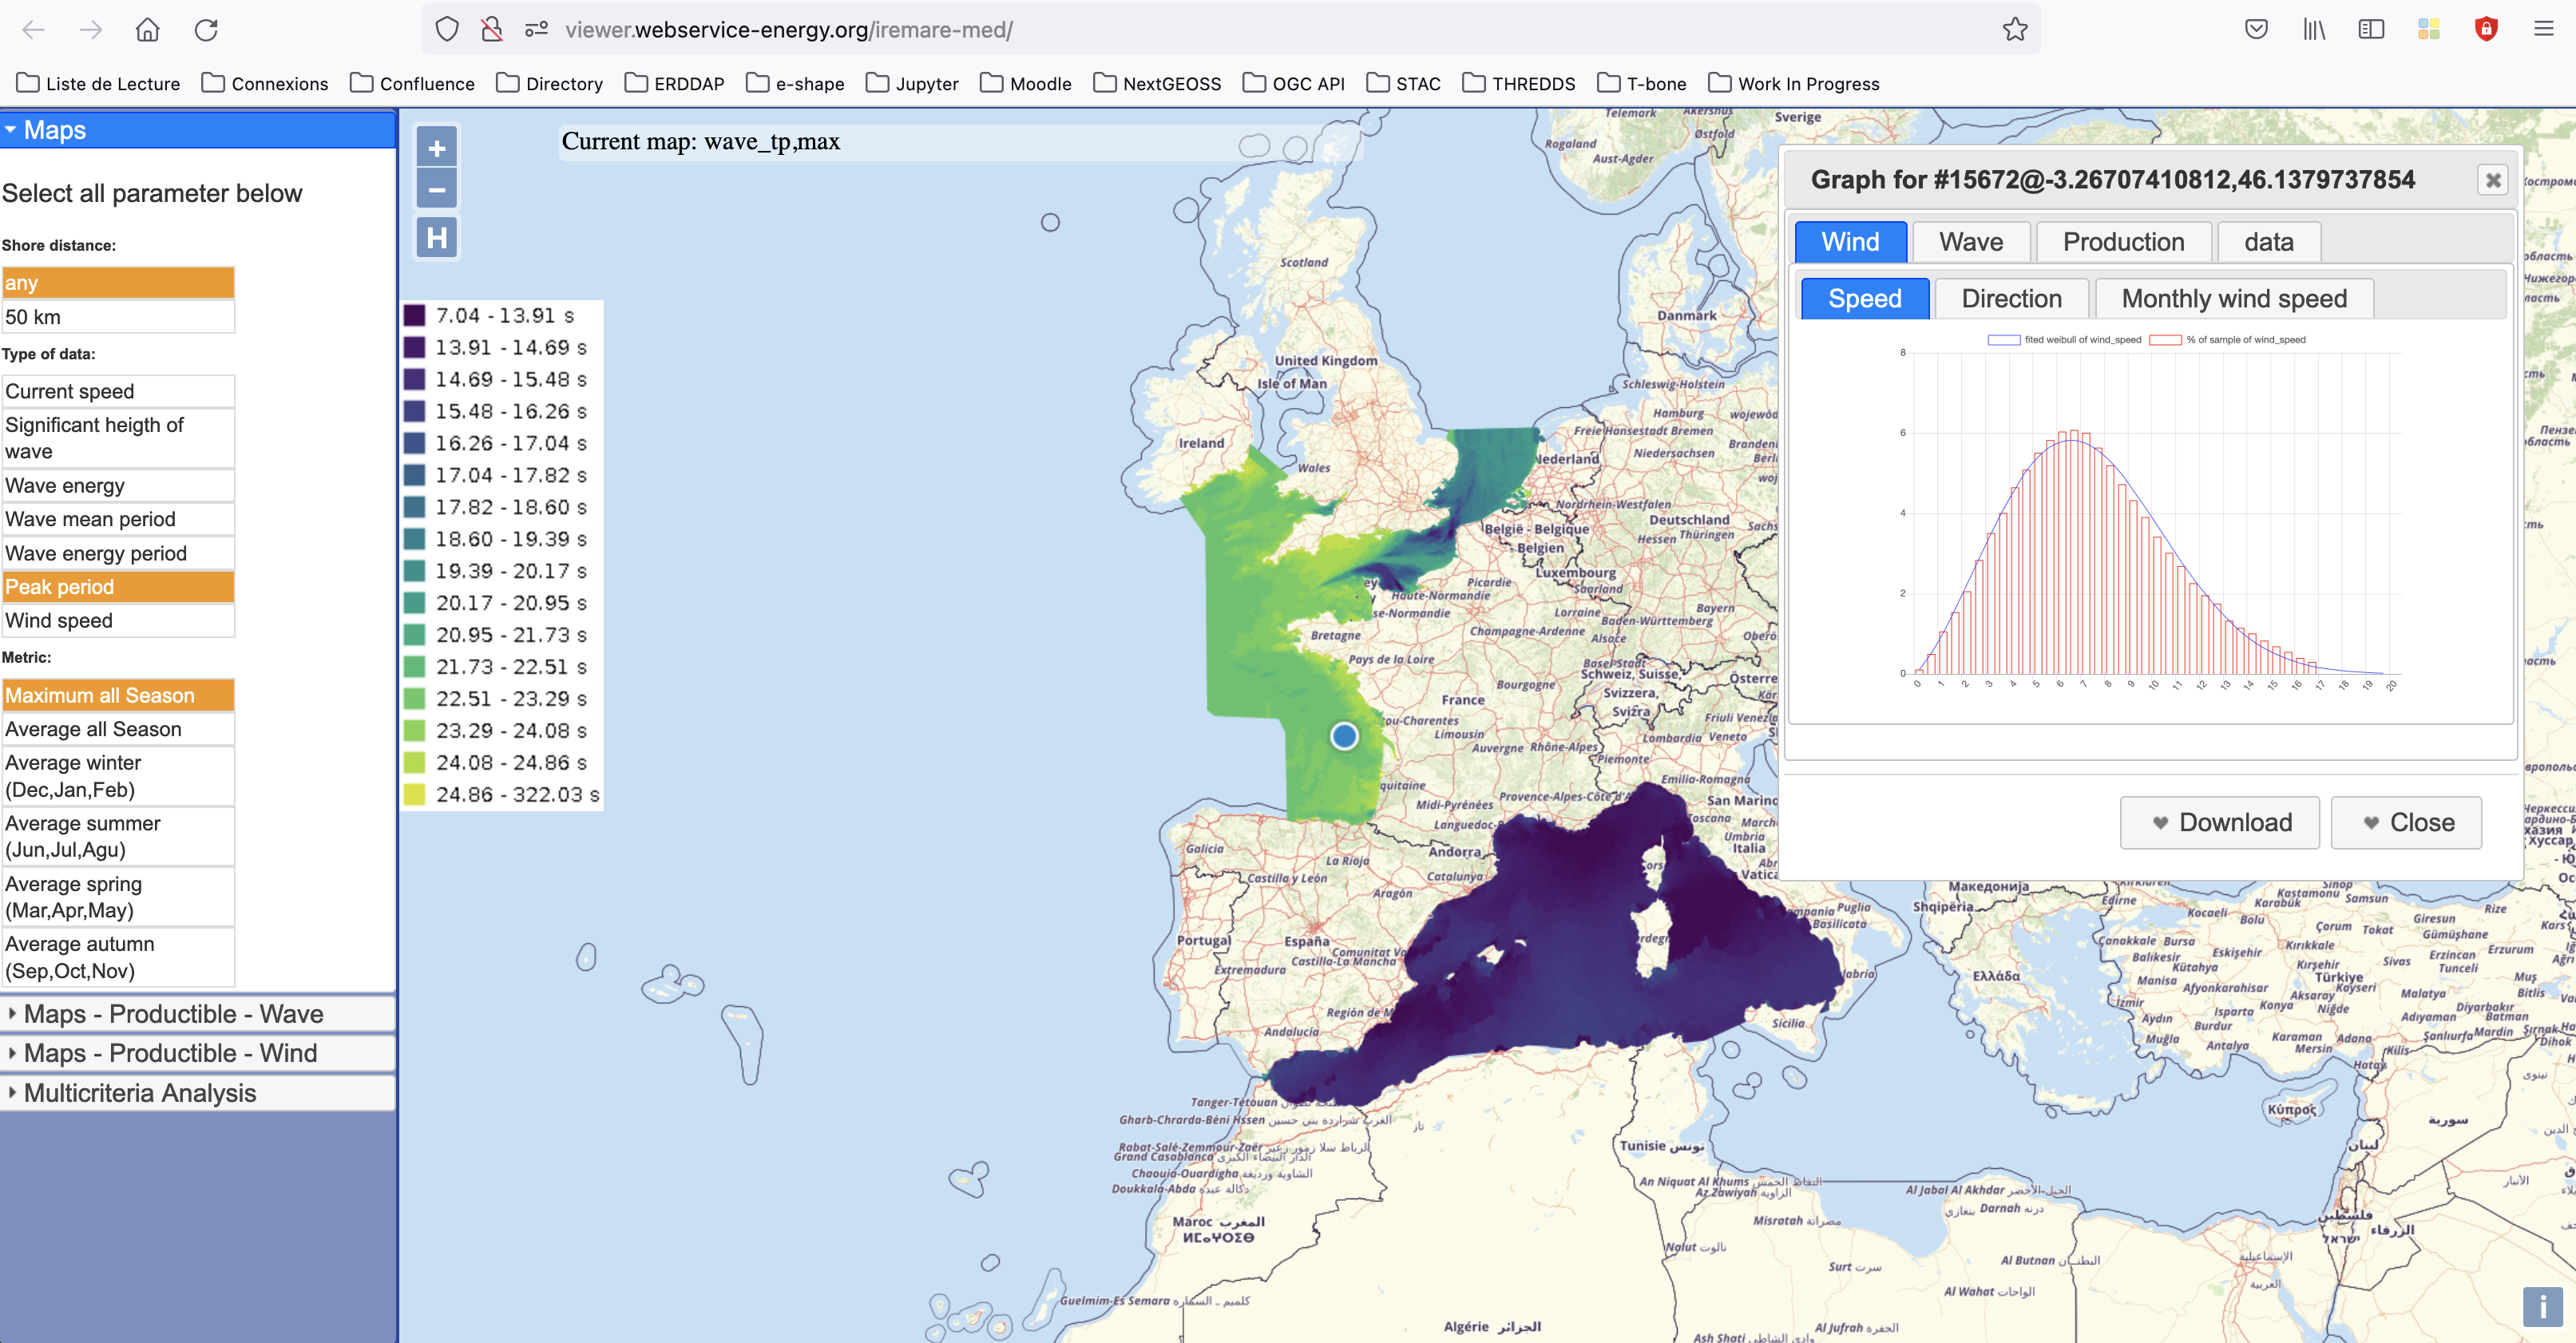
IREMARE (Marine Renewable Energie Resource Information) is a project funded by ADEME (Agency for the Environment and Energy Control, French Public Institution), convention n°1505C0027. It is dedicated to the production and dissemination of high level information about Marine Renewable Energy (MRE) resource. The information produced during IREMARE project covers the western coast of France (Atlantic, English Channel and North Sea) and can be used for national down to local scale studies. IREMARE-MED (Informations sur la Ressource pour les Energies MArines REnouvelables en MEDiterranée/Marine Renewable Energie Resource Information in the Mediterranean) is a project funded by ADEME (Agence de l'Environnement et de la Maitrise de l'Energie/Agency for the Environment and Energy Control, French Public Institution), convention n°1705C0016. It is dedicated to the production and dissemination of high level information about Marine Renewable Energy (MRE) resource. The data comes from the HOMERE database (Boudiere et al. 2013) for the zone Atlantic, Channel and North Sea and from the ANEMOC-2 dataset (Tiberi-Wadier et al. 2016) for the Mediterranean Sea.